Volume Ticker Comparison
Below is the transcript of the video you’ll get access to with your subscription.
Hello everyone. This is Ralph. And today I’m going to show you how to set up the volume ticker comparison study on your chart. First off, I want to tell you what you’re looking at right now, which is a 30 minute chart of the mini S and P. And I have the opening candle of each session highlighted, just so that it’s obvious.
So now let’s talk about the study. Open up the charts study settings. Click on add custom study and find the volume ticker comparison study. Don’t confuse this with the one above it, which is the volume comparison study. There’s a separate video for this and I recommend you watch it. Let’s add this study.
Now open up the settings panel. This study does two things. It compares the volume for the current session at the current candle to the same exact candle, but for the previous session, And then it also tells you if the volume, the current value is below its historical average. One side note while we’re here is that I grabbed the data going back eight years, and I looked at 30 minute volume during the regular trading session of the e-mini S&P.
And the question that I was trying to answer was, what is the average volume per period? And that’s what you see here as the default value for the second input. So now you can use that information to your advantage, and we’ll go over that piece. On the next video, you should change this value. If you’re trading something else, such as NASDAQ or the Russell, but for now, we’ll just leave it at this hitting apply, adds the table that shows you the comparison of volume over time.
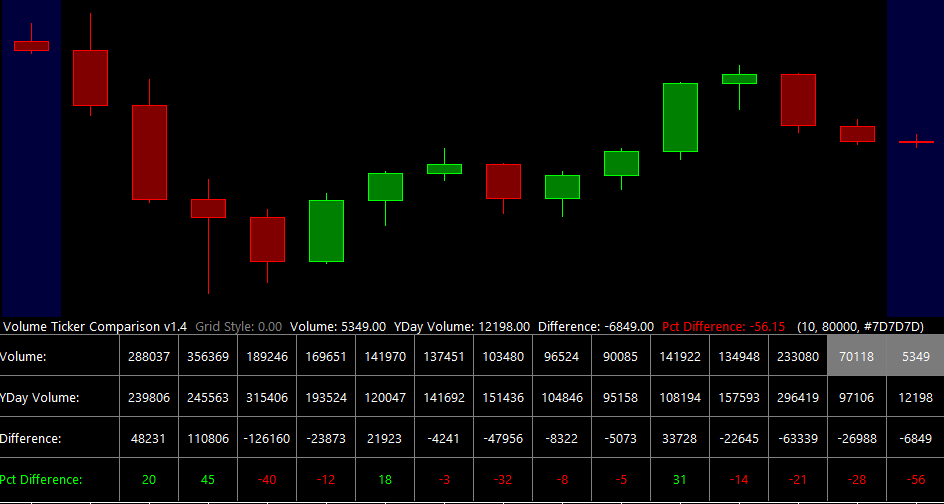
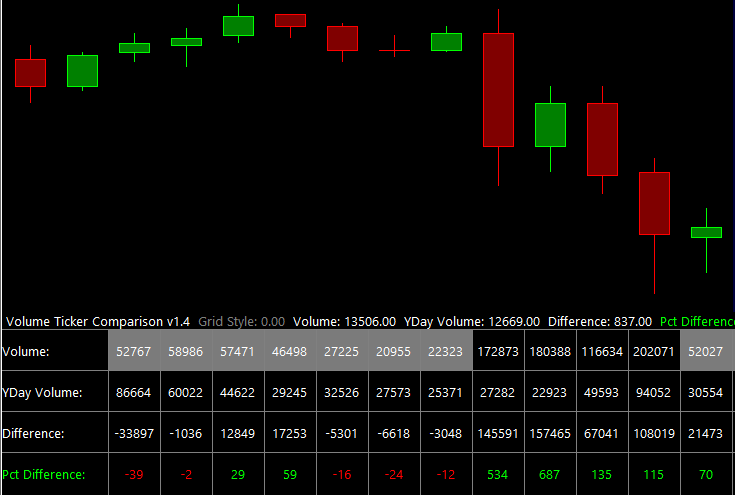
And I’ll just go over each row and what it means this volume row is the most important row. It tells you what is the volume at this candle? And it also highlights the cell. If the value is under its historical average, as we just talked about. The next row tells you what the volume was for the previous session for any particular candle.
So for example, if we’re looking at this candle right here, or even easier, the opening candle, if we look at this candle, you can see that yesterday’s volume was 99,045. And you can validate this by looking at the candle that it is referencing. So you can see it shows nine, 99,045. So this allows you to keep your eyes focused in a single column, rather than going back and forth.
Next, the difference role tells you what is the difference between yesterday’s volume and today’s volume. Going back to our opening candle to this day, if we subtract yesterday’s volume from today’s volume. We get a total of 37,090. You won contracts this year counts for 37% increase in volume. And that’s what the last road really tells you.
It allows you to see at a glance green or red. And what the percentage difference is that you don’t focus so much on the exact contract numbers, but rather you can see it normalized as a percentage. And this is a much easier way to digest the data. So I hope that you found this video useful. Please watch our next video on how to use this indicator for your trading until next time everyone, Happy Trading!