Below is the transcript of the video you’ll get access to with your subscription.
Hello everyone. This is Ralph today, I’m going to show you how to use the previous reference studies in your everyday trading. So I’m picking up where we left off with a previous video on how to set up the studies. If you haven’t already done this, go ahead and watch that video. First, one thing I’ve done is I’ve added a new chart to this chart book.
As you can see down here, I have a file five minute chart, just a simple candlestick five minute chart of the e-mini S&P. And what I want to do is I want to add the references to this chart. So going back to the TPO chart, I’m going to open up the charts study settings. And as you can see, there’s already two different previous reference studies added to this chart.
I’m going to rename these just so that they make a little bit more sense. One of them is for the RTH session. And the other one is for the overnight profile.
Alright, now that we’ve renamed these, I want to duplicate them because I want to plot the same references onto the five minute chart, but I want to keep the ones that we have on this chart as they are. So let’s duplicate these to
open up the settings pane. And the things that I want to change are the name. So I’llrenamed these to five minute. And you want to update the chart number that you want to plot the references on. I already know that the five minute chart is chart number one. So I’ll change this to one.
I’m gonna do the same thing to the overnight study.
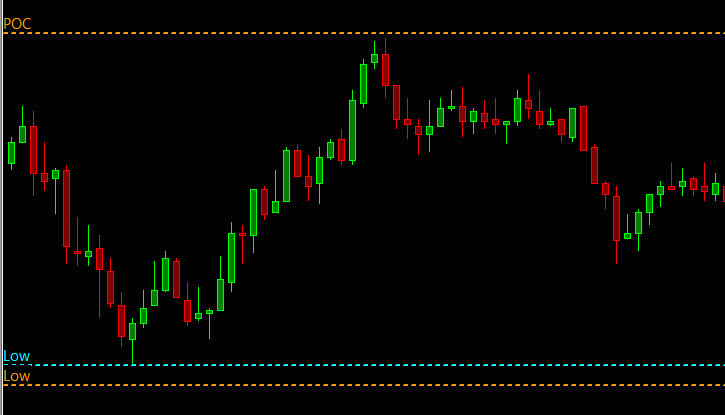
I’ll hit apply. And then I’m just going to reload and recalculate this chart. And now we should expect to see the references plotted on the five minute chart. Let’s see. Perfect. So now I want to explain how you can use this for your advantage. Say you have a chart that is your main chart, where you place trades on.
And in this case, hypothetically, let’s say that that chart is my five minute chart. And I want to see the references from my TPO chart onto this chart. And maybe there’s too many lines for you, so you could remove some of them. For example, I usually don’t use the VPOC. But I’ll definitely leave the POC on. And as you can see prices very reactive, especially when they’re short term timeframe traders in the market.
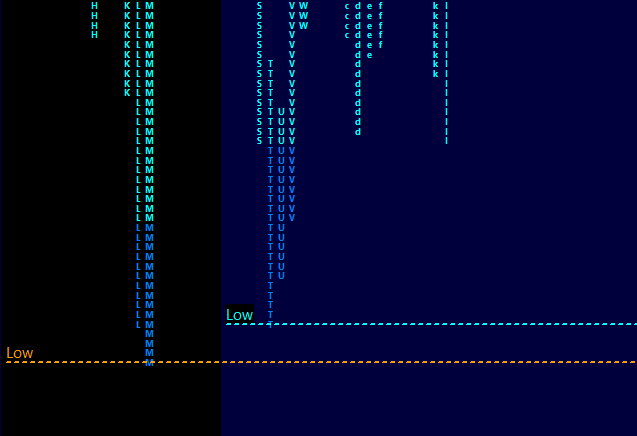
And that’s one of the things that you can use to tell who is participating in the market. So let’s just go over the trading day on Friday, all of these lines come from the overnight session. So the, the blue lines are still developing until the market opens for my time zone. That market opens for me at 6:30 in the morning.
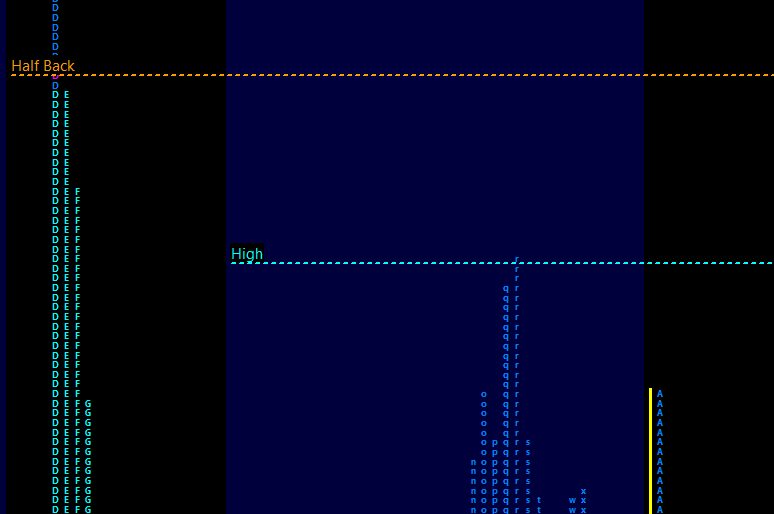
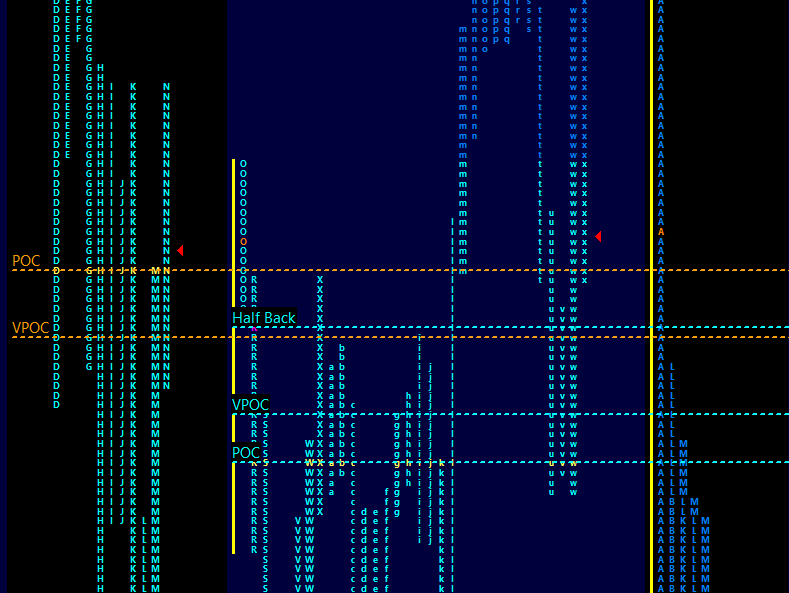
So you have to keep in mind that these blue lines were developing during that time. So let’s focus on the regular trading session from the previous day. During overnight, you can see that we bounce off of the POC and I’ll just highlight some of these so that they’re a lot easier to see. We also bounced off half back and had a little bit of a hard time getting through half back. After the bounce from the POC here are other instances. And then once the market opened at 6:30, actually, this is a pretty good example too, to the tick on the high for this news driven event, you have to put more weight on the regular trading session references, than the overnight, at least I do. Then once the market open, you can see that once again, bounce up the high a few more times. We had some interesting action right here. I don’t know if you want to count that, but I think this kept providing some sort of support throughout the day on the break of this, the POC provided support again, and then we closed.
Towards the high. So this is how I use the references. I wait until price reaches a reference. Once it touches it, you want to wait to see if it’s being rejected or not. If you’re a fast reader, you can take a short every time that it touches one of the references, a short or long, you know, depending on which direction price is coming from.
And you usually want to have a very tight stop. One of the nice things about the previous references. Is that they will automatically update as there are new sessions. So this way you don’t need to spend time moving lines around. And that’s the main reason why I created the study. I hope you find the study useful and can incorporate it into your charts. Until next time everyone, happy trading!