Below is the transcript of the video you’ll get access to with your subscription.
Hello everyone. This is Ralph. And today I am going to show you how to set up the previous reference study. You’re currently looking at my chart that already has the TPO study added, and I’ve modified some of the defaults of that study, just so that it’s easier to see some of the references as you can see, we have the POC, the Value Area.
The open, the close half-back and they’re easy to see now we’ll go ahead and add the previous reference study. Open up your charts, study settings, click on add custom study and find the previous reference study. Add that to your chart and then open up the settings panel here. You’ll see all the different settings that you can change for this particular study.
The first input asks you to select the TPO profile study. So we’ll do that now. This is a study that we’ve already added to the chart. Next, the study asks you which profile you want to target for. Now, we’ll do two profiles ago. So if we look at the chart right here, this was Friday’s regular trading session.
This is the overnight from Thursday and over here, which you can barely see is a regular trading session for Thursday. So this is two profiles ago and this is the session that we will be talking. The third input asks you if you want to target the overnight session for that day. So for example, if we wanted to target the overnight session here two profiles ago, we would select yes.
The fourth input allows you to change the color of the lines. And we’ll do that a little bit later. The fifth input allows you to select a different chart to plot these lines on, and you can use this. If you want to plot the references in a different chart for now, we’ll just leave it at chart two. You can know the chart number by simply looking at the title bar up here on any chart.
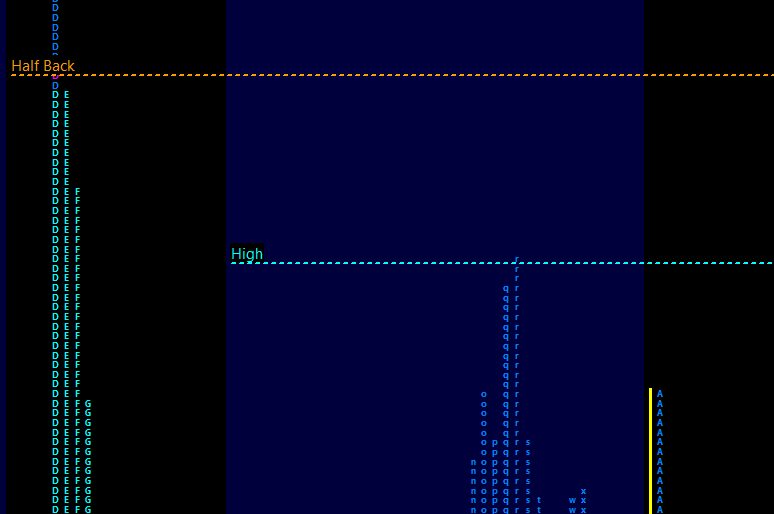
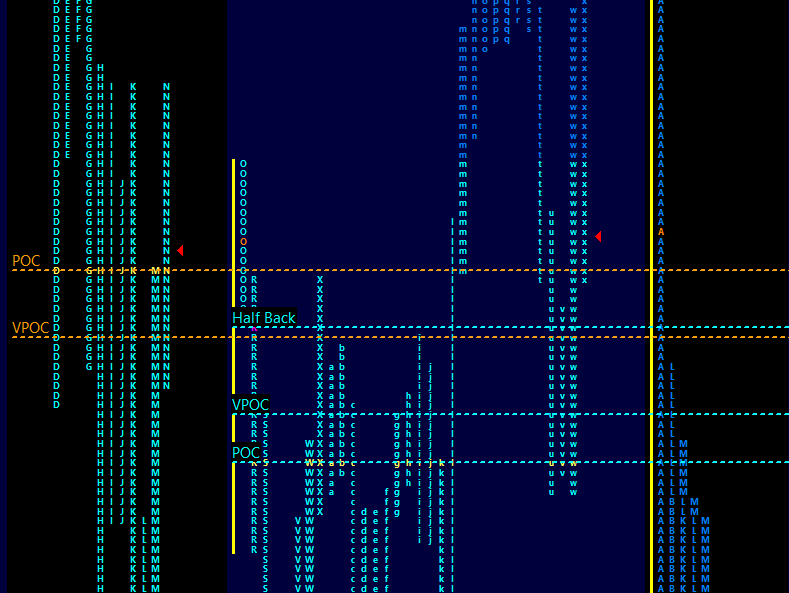
The next few inputs allow you to select which references actually want to show. So for now, we’ll just leave it with the defaults. It’ll draw the reference for POC VPOC, the high, the low, halfback, the rest are set to know by default. And we’ll just leave it at that. The last input. Yes. So you to give it a different ID so that I can use this internally.
And you’ll want to change this. If you add multiple previous reference studies to a single TPO chart, since we only have one, we don’t have to worry about this right now. So let’s add this. We’ll hit. Okay. And we’ll apply the study because it’s the weekend, this chart’s currently not updating as it’s not receiving any data.
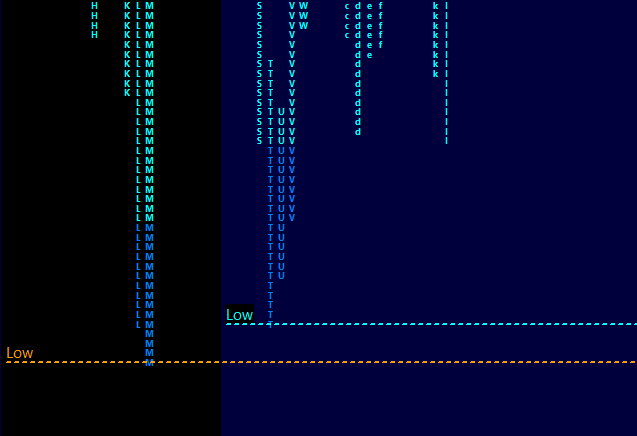
So I’m going to click on chart. Reload and recalculate. And now you can see the previous references added to the chart. As you can see the lines start from the beginning of the period and they extend to the right. Also, you can notice that it targeted the right profile two profiles ago, so that shows you how to set up the study.
One of the really nice things about this study is that it’ll automatically update the references. As new profiles are added to the TPO chart this way, you don’t have to spend time updating the references yourself manually. We’ll do one more thing before finishing up the video. We’ll add another instance of the same study, but we’ll target the overnight profile.
Open up your chart. Study settings again.
And add the study once more.
We’ll go through the same motions again, but now we’ll select that we want to target the overnight profile. And so that it’s obvious when you’re looking at new profiles plotted on the right. We’re just going to change the line color. Let’s do blue for now.
And as I mentioned earlier, you’ll want to change this ID to be something unique. So I’ll just change this number to be six instead of five. Okay. And then apply. And then we’ll reload this chart once more.
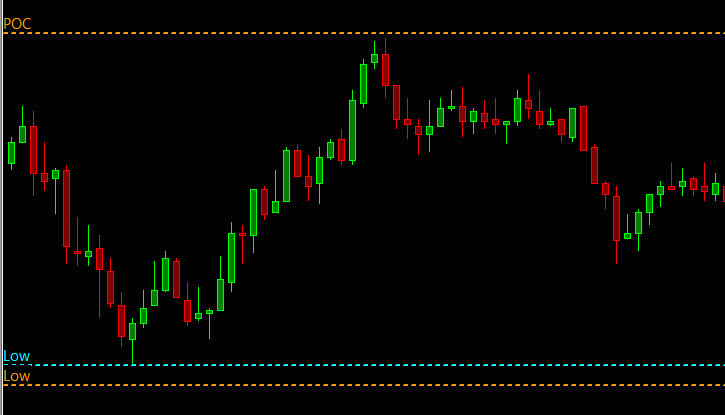
There we go. As you can see. Now we have the references plotted and you can see how price reacts to the references. G came to the high, we close on the high and also on the lows. You can see multiple times we came to half back VPOC, the low and the POC of the pre recessions. So, this is how you can use this study.
Please watch our next video so that you can learn how to use the study in more detail until next time everyone happy trading.