Market Profile Time Framing Bubble
Below is the transcript of the video you’ll get access to with your subscription.
Hello folks, this is Ralph. And today I’m going to show you how to use a very simple study that I’ve created. It’s the market profile one time framing bubble, as you can probably already tell if you’ve watched a few of my videos, I like to have as much data on one of my charts as possible, because I don’t like flipping through a lot of different charts.
So I want to aggregate all this data and put it all into one chart as cleanly as possible. So this is one of those instances. So I have two charts right here in front of you, one, which is a 30 minute candlestick bar of the e-mini S&P. And the other chart, which is a 5,000 tray chart of the e-mini S&P.
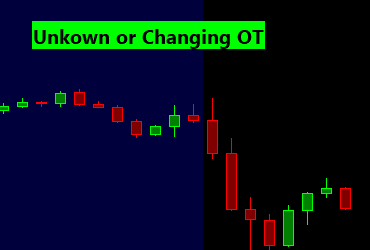
If you watch some of my videos, you know, that I use the 5,000 trade chart a lot, and that’s usually my main trading chart. So what I want to do is tell if the market is currently one timeframe up or down or if we’re currently in the middle of changing timeframes. If you don’t know what one time framing means. I suggest that you do a little bit of reading about this, but to give you a quick explanation, if we go back to the 30 minute chart, one time framing basically means that one market profile period, meaning a 30 minute period has cleared either the low or the high of the previous period.
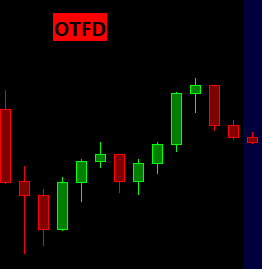
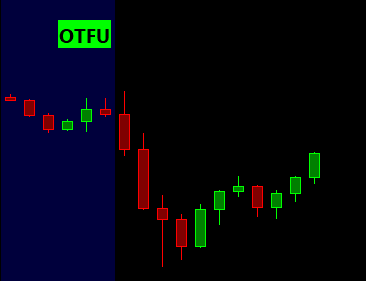
So this means that this green candle, for example, is now one time framing up. As we’ve cleared the high of the previous candle, you typically don’t want to make a call on a direction change immediately, but instead you’ll maybe want to wait for another period before you call this one time framing up.
But either way, as you can see here, each period is clearing the high. So we’re currently one time framing up. And none of these periods so far have cleared any of the lows of a previous period until right here. So as you can see this period right here cleared the low, which means that now we’ve stopped one time framing up and could potentially reverse.
If we look at the example from the morning, we were one time framing up here. This period did not clear the low, but also didn’t clear the high. And then we continued one time framing up until this period cleared the low. And then the following period continued further down. These are the basic mechanics behind one time framing.
And you can use this to gauge if the market’s in a trend or not. So it’s very simple stuff. Now let’s get back to the study, open up your charts, study settings, click on add custom study and you’ll find the study in their statistics. Bubbles. If you open this up, you’ll find the onetime framing detector.
Add this to your chart. And then let’s open up the settings pane in here. Most of the inputs relate to the bubble itself. The main input that you’ll want to be playing around with is going to be the first one, which allows us to pick which chart. We want to place the study on. So for now, we’ll just leave it at two so that you can see it placed on this chart, but we’ll want to move this over to the 5,000 trade chart.
We’ll leave the rest of the inputs as they are. They’re not really relevant to how the study performs, but rather how it paints the bubble on the chart. We’ll click on. Okay. And then we’ll add this and as you can see, This small little bubble that doesn’t take a whole lot of space can give you a visual cue as to the market’s direction.
Okay. So now let’s move this bubble over to the 5k chart. I already know that the 5k chart ID is number one. So I’ll delete this little bubble and then I’ll open up the study settings again and change this display on chart number from two to one. I hit apply. And now if we go over to the 5k chart, we should see the bubble here.
Beautiful. So it’s that simple. And now this little bubble will update as the day progresses. This will work during regular trading hours and during the overnight session. And I use this as part of the whole statistics package to tell me market stats so that I can get a better picture of where the market is going.
I hope that you can make use of this little study. Until next time, everyone happy trading!