Below is the transcript of the video you’ll get access to with your subscription.
Hello folks, this is Ralph. And today I’m going to show you how to use the breath bubbles. If you haven’t done this already, please go ahead and watch the setup video on how to go through and set up the breath bubbles. Because right now I’m just picking up from where we left off. So we’re looking at a one minute chart of the e-mini S&P futures that has all the underlying data to calculate, you know, these two bubbles and the underlying data is the volume down volume for the NYSE and for the NASDAQ.
I’ve also gone ahead and added a new chart, which has a 5,000 trade e-mini futures chart. And I haven’t done anything to this chart. Let’s do two things in this video. One thing I want to move the bubbles from the other chart that has all the underlying data that I don’t want to look at all the time onto this chart, because you can think of this chart as the chart that I used to place trades on.
So it’s a chart that I want to be looking at at all times. So let’s go ahead and do that. Now, let’s go back to this chart and open up your charts study settings. Click on settings for the breath bubbles. And all you need to do is figure out which ID that chart has and then just change the display on chart number.
I already know that the 5,000 trade chart has an idea of one, and you can figure this out by looking at your title bar. You may barely be able to see this, but this is number two. So I’ll go ahead and change this to one and I’ll hit apply. You’ll have to manually delete these if you care. And then we can go over to the 5,000 trade chart, and now you can see the bubbles here.
So this is great. Now we can put the bubbles on a truck that we care to look at. The next thing I want to tell you guys about is what values you can expect with the bubbles in terms of averages, extremes, and really, really extremes. So let’s get into that. So, if we talk about the NYSE first, normally during a ranging market, you’ll get values between one and three, both positive and negative.
And typically it’ll just be in the ones. One to two is usually what I consider ranging for the NYSE. A strong directional value would be three and above. Usually I like to see 3.5 to 4, once it’s at six or seven, that really gives me high confidence that the underlying stocks of the market are trending up or down, depending on if the breath is positive or negative.
And lastly, I’ve seen the nicey on really strong selling. I’ve seen it, and this is going to sound crazy, but up to 140 or 160, which is huge, right. Everything is selling and that’s when we had the sell off over the coronavirus. And then conversely, when we started ripping up, you saw the same thing, but to the point positive side.
Now obviously what I’m talking about, those extreme numbers are going to happen very rarely. And it’s not something that you should come to expect at all, but they will happen at some point during your trading career and you need to be ready and you need to make sure that you’re not trading against the market because you’re either think that you’re catching the top or catching the bottom because it’s so stretched out.
If the breadth underneath the market is at extremes, it doesn’t matter. The market will just continue in that direction. So I hope that you can use that to your advantage. So now, if we talk about the NASDAQ breath, instead of like the NYSE that I consider from 1 to 3 to be a rotational day NASDAQ, I would consider it from 1 to 2 to be rotational.
Once it gets to two and above that typically means that. The stocks and NASDAQ are moving strong up and the NASDAQ index is also moving strongly up or down if it’s negative. And again, there’s really extreme values of that. I’ve seen of like 24, 25 on big sell off or big rip days. And I think this is what really helps trade those days because you have to know the strength behind the move.
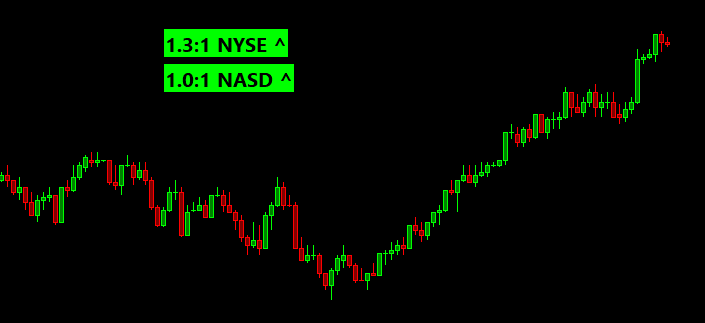
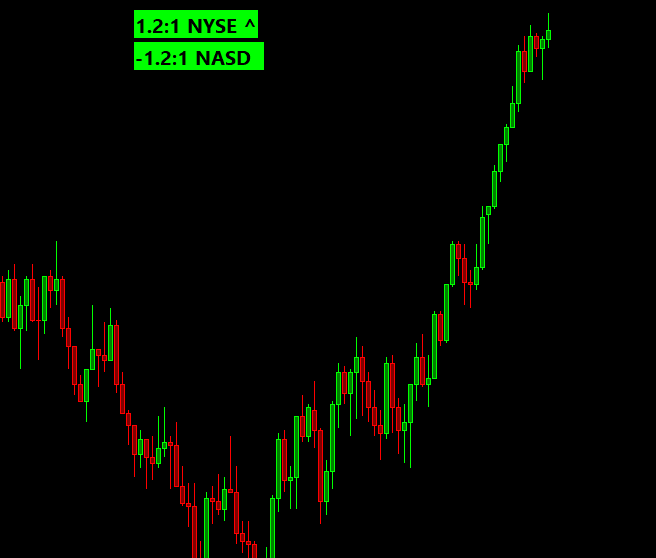
So that concludes the second piece that I wanted to tell you about. I actually want to go through and quickly replay today’s trading session so we can see how they look real time. Even though I will be speeding up the replay, there work best whenever data’s being played through at a normal rate, because the bubbles themselves will tell you if their values have been trending up or trending down and typically what you’ll see, for example, if we look at this little trend that we had today, Towards the top of it. You’ll start seeing a little carrot that is pointing up. Sometimes you’ll see it in one. Sometimes you’ll see another, but sometimes you’ll see a carrot pointing up on both. That means that the values that proceeded the current value that you’re looking at were lower than the current.
And that’s just the, you can, um, that you can tweak if we go back to. The other chart and look at the settings here, the trend length, it looks back at four values, and then it tells you if it’s, if the values are trending. So for example, if the night, just to make it super simple, if the nicey breath was five to one, then the previous four values had to be below that.
So imagine the one before that was four, the one before that one was three. Like 3:1. And then the one before that one was 2:1 and so on 1:1. Right? Super simple example, but the values are trending up and therefore it tells you that, that the trend is moving up and that’s something that you don’t really get from any other breath, bubbles that I think this gives you a little bit more context as to what happened previously.
So, I find that super helpful. And we’ll try to see that during today’s trading session, it may be a little bit hard to see because we’ll be speeding up the replay, which means that it’ll skip, you know, some of the values, um, simply because we’ll, we’ll be speeding it up, but I’ll try and play through this, sell off today and you should see at least the NASDAQ trending down.
So let’s go ahead and do that now. I’ll make sure that I have all charts and chartbooks selected because I want to replay this chart and the breath chart want to replay same as real time. Make sure that the data’s correct. Eight 11 and let’s just begin. We’ll just begin at the beginning of the day and see what happens here.
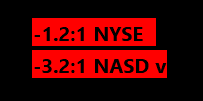
Alright. So the market’s about to open… NYSE opened up strong four, four, two, one three seven. NASDAQ is a little weak. So you just know that you’re going to get a little bit of chop because one of them is positive and the other one is negative. Even though the e-mini, which is tied to the NYSE more than the NASDAQ, they’re both still correlated, but now you can see, you can see the carrot coming up here and there, meaning that we’re now trending down. And it also turns the bubble red, even though the value is positive two to one, and that really helps. Tell you that even though we’re positive, we’re actually trending down, even though we’re not negative yet.
So I know that somewhere around here, we’ll, we’ll start, you know, we’re essentially balancing for most of the day. And then later in the afternoon is when we started selling off. I’m going to speed it up just a little bit till we get to the, to the point where we sold off.
Now you can see they’re both turning green and really the way to use this is to look at the bubbles to validate that the trade that you’re in or about to take is in the right direction. The bubbles themselves can be lagging often, but if you’re someone who trades reversals halfway through your trade, or like shortly after your trade, The bubbles themselves should be validating the direction of your trade.
If I’m looking at this today, I’m thinking this is likely going to be rotational because we have the NASDAQ negative and we have the NYSE a positive, and it’s not over three, which is what I would consider really strong, but it is on the high twos and it makes sense. Right. We’re seeing the market slowly moving up and up slowly moving higher and higher. I know that’s somewhere around the 74 area I believe is when we started selling off, but it took a little bit longer. It wasn’t till around, I think 11 o’clock that, that we’ve really seen, started selling. So I’ll speed it up just a little faster.
And then I’ll slow it down. Once we get to around 11:30. Let’s see, I think we do one last push and then we started selling off here. Yep. Here we go. And as usual selloffs happen way faster than the stairstep up.
And now you can see, I mean, it happened really fast, but you could see it going from 2.5 to 2, and now it’s trying to be stay at 1.0 on the NYSE. And the NASDAQ is trying to turn more negative. My guess is if we were playing this out regular speed, the NASDAQ bubble would have turned red a long time ago.
We just saw 1.5:1 Flash.
And there may be a bunch of values here that we’re missing because we’re speeding up the replay. But now you can see the NASDAQ is at negative two and above which means really strong, or at least for me, that means it is a strong, directional move. Um, and of course, with context, you need to keep in mind that I’ll just stop it here.
You need to keep in mind that. Right here is the close of the cash market at one o’clock my time. So, you know, sure enough, we sold off strong into the close, but we’re likely not going to continue selling after a huge already sell off, especially as the market is closing. So context matters. I think I’m going to wrap it up here.
This should give you a good sense in how to use the bubbles, how the breath works. If you have any questions, please send them over. Happy to talk to anybody about this more. And until next time everyone, happy trading!


