Below is the transcript of the video you’ll get access to with your subscription.
Hello folks, this is Ralph. And today I’m going to show you how to set up the breath, bubbles on a chart. So let’s get started to calculate the breath bubbles. We need the underlying data of the tickers that are ticking up and down for both the NASDAQ and the NYSE. So let’s add that data now, open up your chart study settings and in here, find the “add additional symbol study” and add this study 4 times.
Then open up each one of these studies and you’ll have to type the following symbols in
the up volume for the NYSE,
the down volume for the NYSE. And then we’ll do the same thing for the NASDAQ.
And then the down volume for the NASDAQ.
If I did this correctly, I’ll hit apply and you’ll see four new subgraphs added to this chart. If you haven’t already done this in the past, your system needs to download all the underlying data. So you’ll see next to the ticker the text that it is downloading, it just be patient as your system downloads the data.
So as you can see, now we have the underlying data to be able to calculate the breadth. So now we can go ahead and add the bubble. Let’s do that. Now, go back to chart, study settings, and then click on add custom study under statistics, bubbles. Find the breath bubble and add it to your chart. Open up the settings. The first input asks you which chart you want to place the bubbles on for now. We’ll just use the current chart that we’re on the next four inputs, ask you to point it to the underlying data.
This is the data that we just added. So let’s go ahead and update them now.
You simply need to match them up.
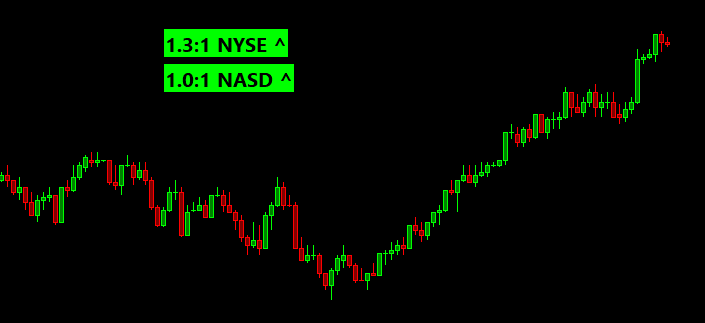
Perfect. We’ll talk about the following inputs in a little bit for now. Let’s go ahead and apply and see if the bubbles get added to the chart. Perfect. Now you can see these two bubbles being added to the chart. As you might have noticed, the scale for price has changed. If you actually want to look at this chart, which I don’t really recommend it, I would recommend you simply minimize this chart and place the breath, bubbles on a different chart that you actually care about because you don’t want to be looking at the underlying data all the time. But for now, if you open up the settings and click on sub graphs, there’s two sub graphs that are making the price scale change. And these two sub graphs contain the data that you see in the bubbles. The nice thing about this is the other studies can then consume the data. But for now, let’s not get into this. We’ll change these two to ignore and hitting apply should fix the scale for us. Perfect. So now I’d like to talk about the mechanics of the bubbles themselves. The bubbles are simply just a ratio. So, for example, if there’s a total of a 100 stocks in the NYSE and 50 of those stocks are advancing in 50 of them are declining, then you’re going to get a ratio of 1:1 right?
There’s the same amount of stocks advancing versus the same amount of stocks that are declined. Another example would be if there’s 75 stocks advancing in only 25 decline. Now you have a ratio of 3:1 as there is now three times the amount of advancing issues versus declining issues. So now the way that the bubbles represent it is by having this colon, right?
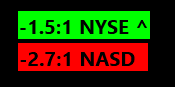
So if the bubble is green, you know, that there’s more issues advancing than the ones that are declining. Going back to our example, if there’s 75 advancing issues in 25 declining. You’re going to see a ratio of 3:1. On the other hand, if we look at NASDAQ and we take the same example that I just talked about, but instead we changed the example to be 75 declining issues in 25 advancing issues.
Now you would have a breath on the NASDAQ of negative -3:1, and that’s why the ball was red because there’s more declining issues. And it’s as simple as that, that’s how you want to read it. The reason why it’s a ratio is so that it is normalized across the two, and it’s easier to consume. On the next video on how to use the breath bubbles, I’ll talk about more in detail of what you can expect, correct. In terms of extremes and normal trading in terms of what is normal. And what’s an extreme, both the NYSE and the NASDAQ, because they behave very differently and you really only get that feel through experience. So you have to watch this for a long period of time for now, let’s look at the rest of the inputs for the study. So back to the study settings,
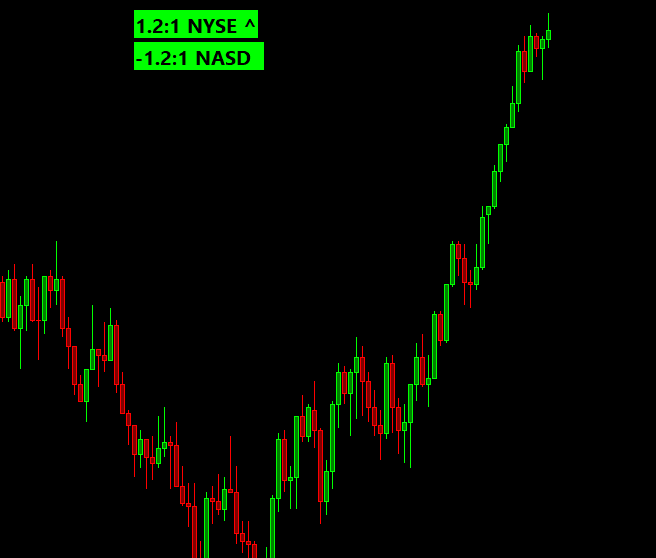
the next input that I’d like to talk about is the show decimal input by default it’s. Yes. And that’s why you see on the NYSE. You’ll see 1.2 in NASDAQ, you’ll see. Negative 1.0. But if we flip this over to now, you’ll notice that it simply gets rid of the decimal. It really depends on what you prefer to look at.
I’m going to switch this back over to. Yes. All right, so let’s go over the rest of the inputs here. The next input is the trend length. And to show you how this input works, I’ll have to replay the data, but I’m going to do this on the next video so that you can actually see how these bubbles work while the market is live.
But in essence, what this input does, it calculates if the breadth of either the NYSE or the NASDAQ has been trending up, or if it has been trending down. Because one of the things that I struggled with just the basic bubbles was that, that you only got the data of what is happening right now. And you had no insight or visibility into what the values were previously.
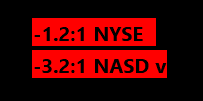
So with a carrot that will show up the very end pointing either up or down now you’ll have. That insight of how the last few values look like. Meaning if we were turning up, then that means that the previous values were lower. And I find that super helpful while I’m trading. So I’ll show that to you in the next video.
The next input is related to the previous one and it basically affects how we color the bubbles. So if we’re in a trend up, then we’re going to color the bubble green. Even if the breadth is negative and we’ll do the same thing in the opposite direction. So take the nicey breadth and imagine that it’s been trending down from 5:1, then 4:1, 3:1, 2:1, and now it’s at 1.2:1. This would plot a little carrot pointing down right here and it would make the bubble red. If you don’t want the bubbles color to be dictated by the trend, then just change this input to no the last four inputs, basically tell the study how to render the bubbles. So I won’t go over these right now.
So that concludes the setup of the breath. Bubbles. I hope you found this video useful and go ahead and watch the next video on how you can incorporate the bubbles in your everyday trading. Until next time everyone, happy trading!