The Gamma Exposure Study provides a real-time, options-driven view of market structure—designed to help you anticipate volatility, identify key price levels, and understand where dealer flows may create support, resistance, or acceleration zones.
GEX Chart
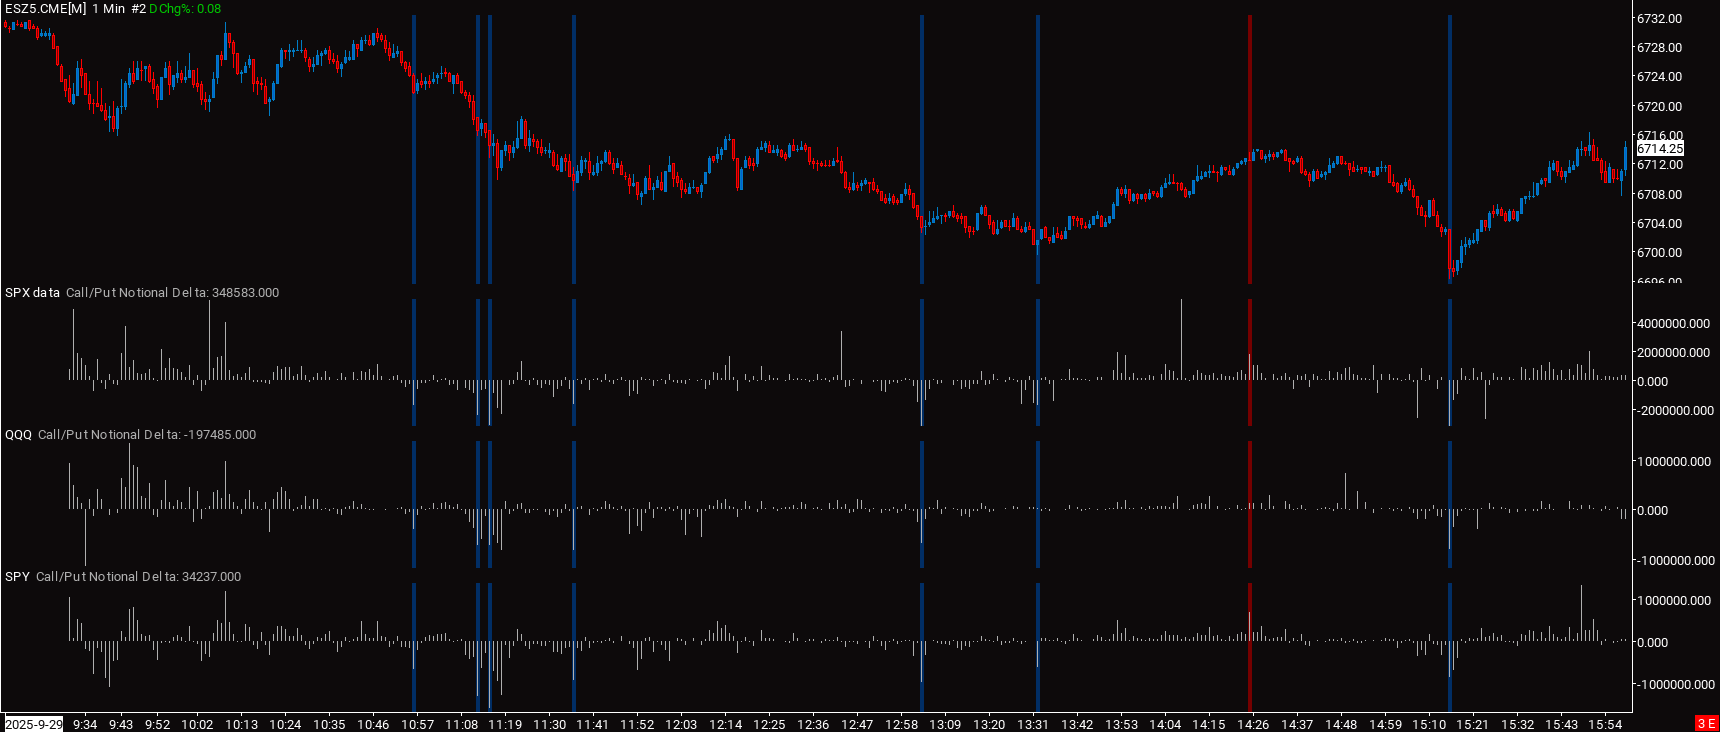
A live, intraday visual of Gamma Exposure (GEX) and Delta Exposure (DEX) for 0DTE SPX options.
- Gamma Exposure (GEX): Understand dealer hedging requirements as price moves occur.
- Delta Exposure (DEX): Visualize directional dealer flow to anticipate potential squeeze/fades.
- Call/Put Ratio (CPR): Visualize call/put ratio in notional and raw value to gain an additional edge.
- Real-Time Updates: 2 second data refreshes throughout the session to reflect evolving options positioning.
- Zero Cross Alerts: Customizable alerts trigger when GEX or Delta shift market regime.
Key Levels
High-conviction support and resistance zones derived from options positioning.
- Call/Put Dominance: Distinguish between areas with high call or put open interest, volume, or traded activity.
- Consolidated Level Display: View highest volume, most active strike, and top open interest at a glance.
- Real-Time Adaptation: Levels update intraday as positioning changes, keeping your view relevant.
Gamma Map
A centered heatmap view of the most impactful options strikes surrounding the current price.
- Strike-by-Strike Visualization: View up to 60 strikes color-coded by call/put GEX concentration.
- Proximity Focus: Automatically centers around the underlying’s current price, so you’re focused on what matters most.
- Scalable View: Customizable expiry windows and strike intervals to suit your style and timeframe.