With the reconstructed tape downloaded and setup, you’ll be able to view the tape for any tradable security on your platform.
Below is the transcript of the video you’ll get access to with your subscription.
Hello everyone. I know it’s been a bit since I’ve made a video, but there’s a new study that actually one of the users of the studies paid for, so they essentially sponsored me in building an additional study to the reconstructed tape. Since I know a lot of people use a reconstructed tape, and this is actually a great addition to it, it’s a great tool, I figured I’d make a video to teach you all how to use it. So, you’ll find it under the reconstructed tape whenever you go to add a custom study, and then you go to the reconstructed tape. You’ll see it in there. You should see it in there now. It’s been released now for about a month or two since I built it for this user, and it’s called ‘slippage lines.’ So, you’ll find one that’s called ‘slippage lines’ right here. There’s really no inputs here; there’s only a subgraph, but there’s nothing for you to really change here.
So, what are we looking at here? There are two different graphs, one of them which has this new feature, which is under the chart V2 study. So, if you go to chart V2, you click on settings and inputs, you’ll notice that there’s this new input called ‘only show sweeps,’ and you can toggle it yes or no. I’ll explain what it means in a second. So, that’s part one of the feature, and then part two is this other study that is a subgraph which is called ‘sish lines,’ as I mentioned. Okay, so I don’t know what’s going on here. I think I’m just going to disconnect, so we don’t see this message here. All right.
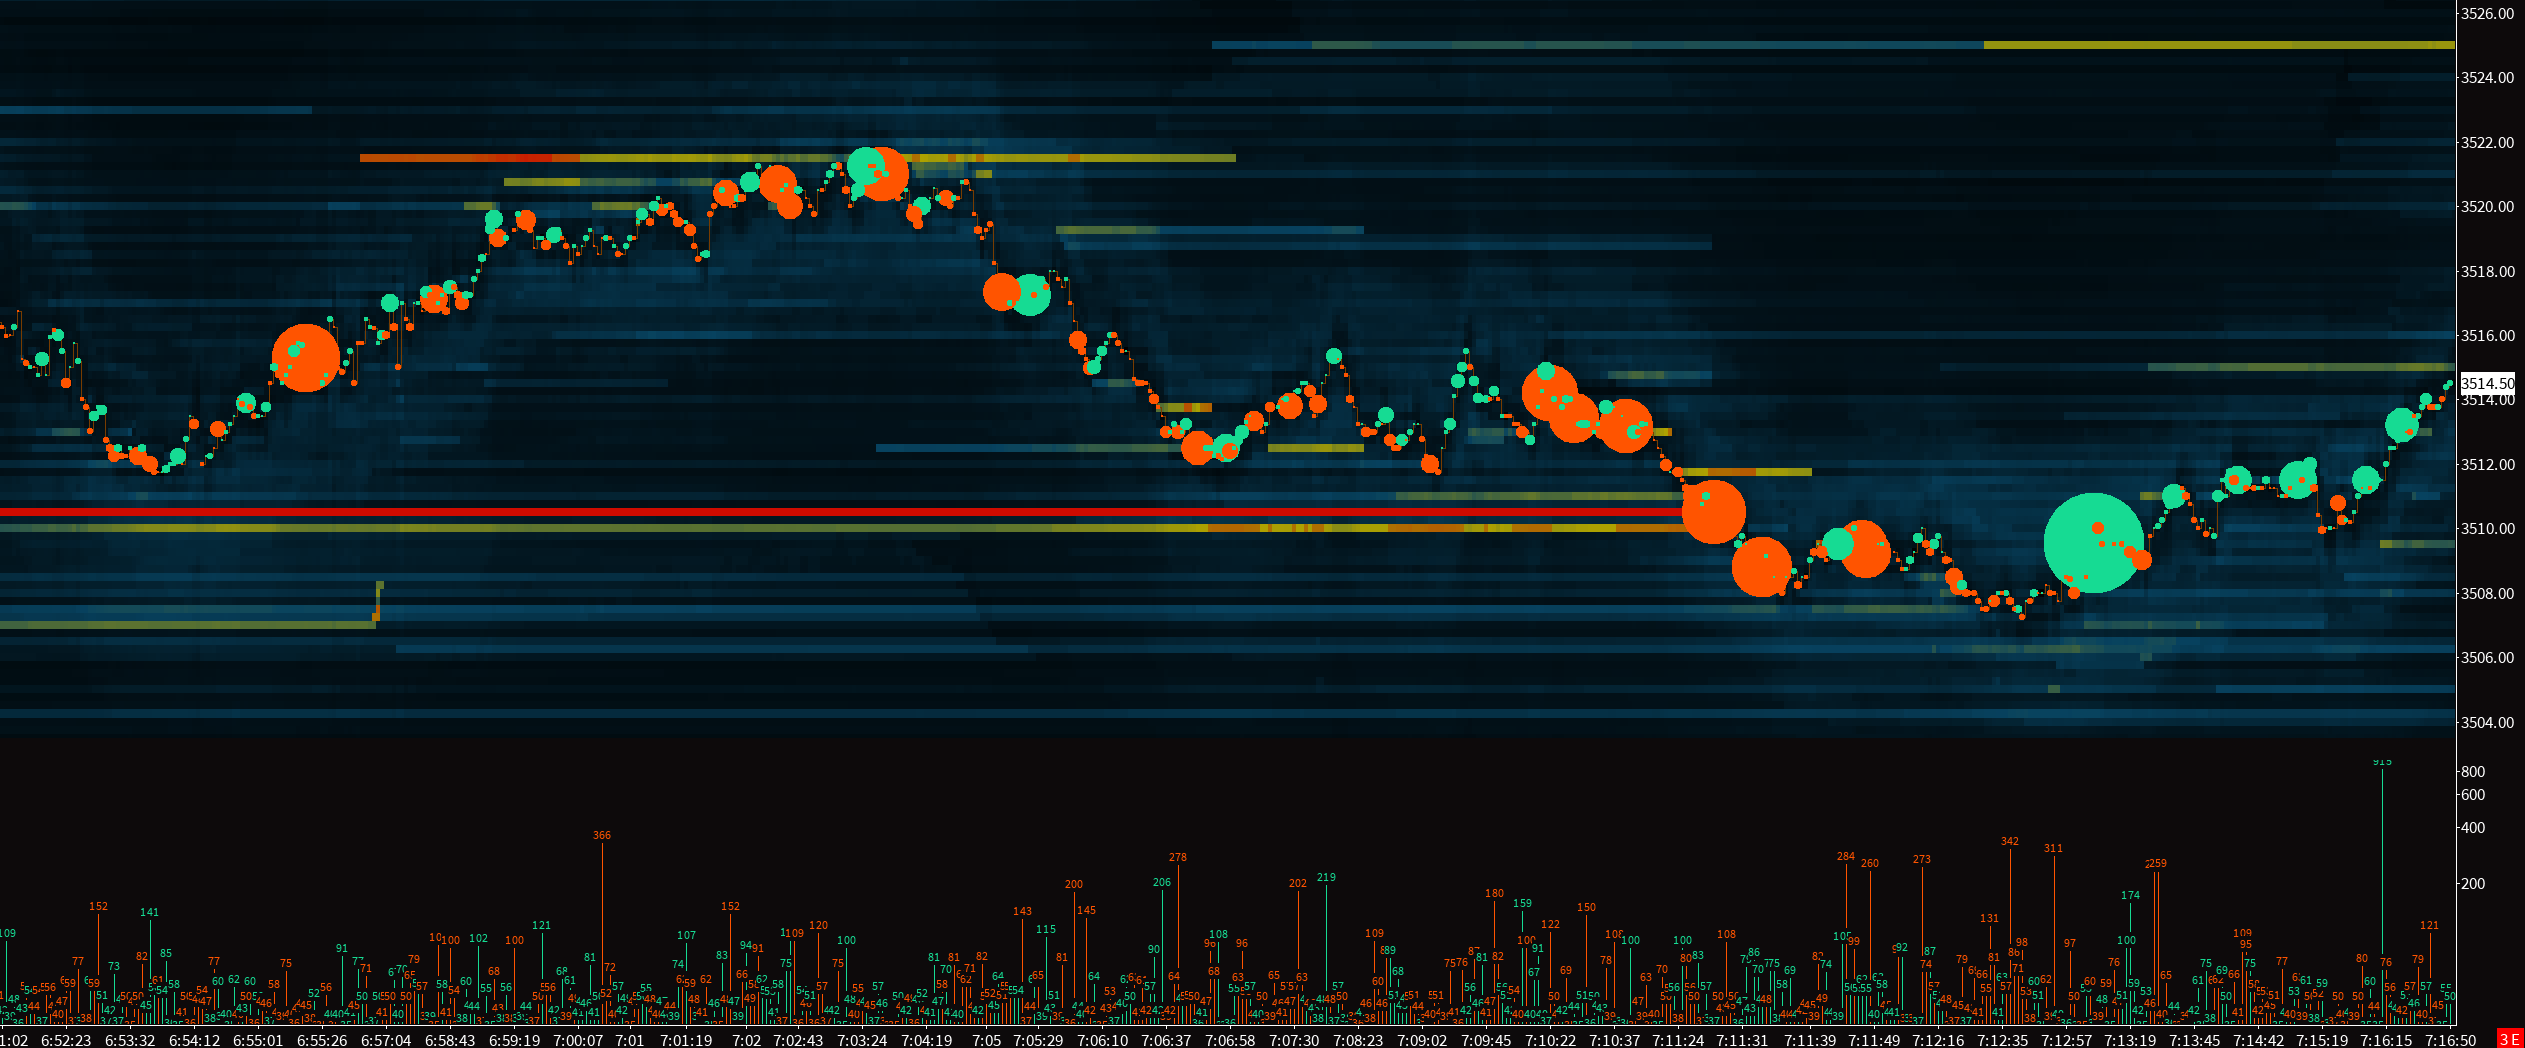
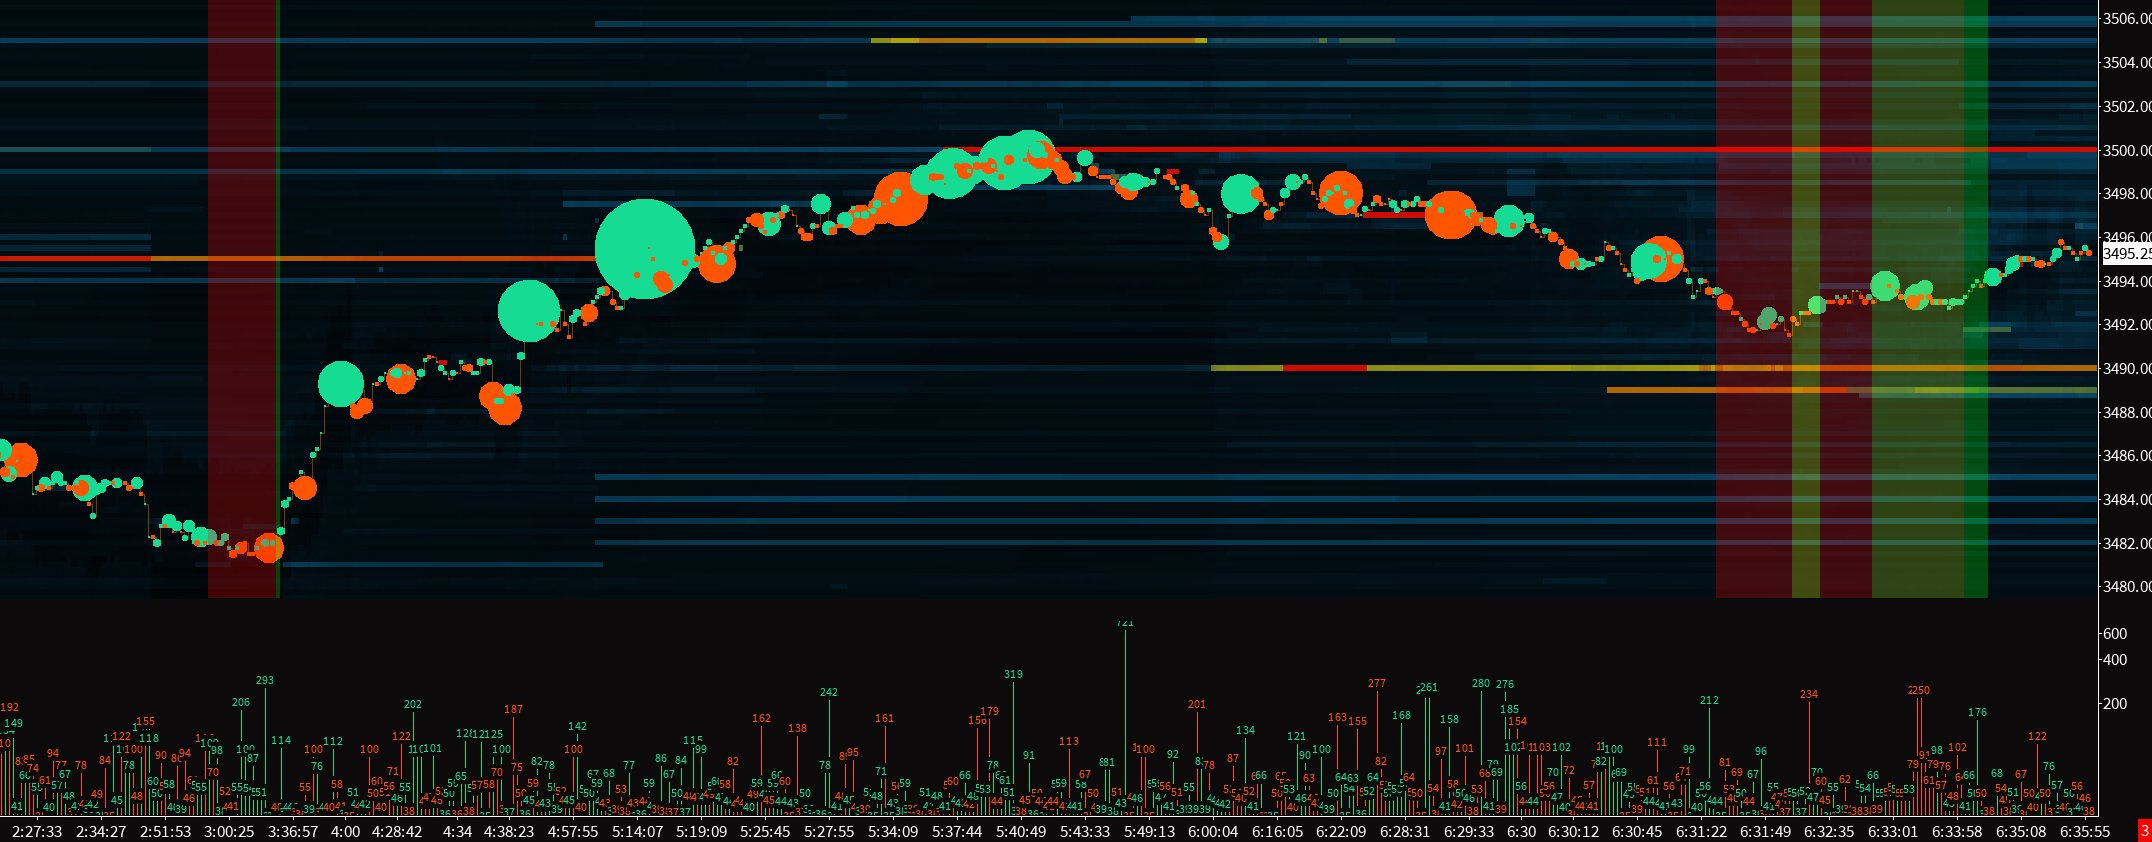
So, with that new input of ‘only show sweeps,’ let me first describe what a sweep is. A sweep is when a market order hits, you know, it’s either a buy or a sell market order, so it’ll hit the bid or the ask, just hypothetically speaking. Let’s take one of these that has a large number. This one right here has 11, so it slipped 11 ticks. This large market order of almost 2,000 contracts on the E-mini, and that’s essentially what it tells you. It’s when this market order, when this buy market order was executed to fill this entire order of 1931 lots, it had to sweep 11 ticks in the order book for it to fill that entire market order, okay? And that’s that. What the input that I was talking about does is it basically filters market orders so that you only see the ones that do have or did have slippage.
One thing with these market orders is that somebody’s trying to get into a position or out of a position as fast as possible because obviously, you’re not going to want to lose out on 11 ticks. It’s quite a bit of just slip. You’re likely in a drawdown right away. So, having this information is quite useful. And then on the bottom here, I have the same reconstructed tape, all the same setup. The only thing that I’ve done is that I’ve changed this to ‘no,’ so yeah, if you can see, there’s just a lot more orders down here in this graph down here because it has a lot of orders that didn’t slip the order book, which means that the entire order filled at the top of the book, either the bid or the ask.
So, if we zoom in here, for example, just so that we can see one of these numbers. So, for example, this sell of 41 lots right here, it didn’t slip at all. There were bids that were enough, their limit orders that were there, so this sell of 41 lots filled at the top of the bid side of the order book, okay? So, I’ll stop there with the explanation of the study itself and I’ll move over to how to use it. Hopefully, this makes sense and helps you understand what the new input does and what this ‘slippage lines’ study gives you. I’ve actually been only lately, I’ve only been focusing on having this graph like this one. So, I have a filtered version of the reconstructed tape. I’m not seeing everything as granular as I used to because what I’ve been looking for, and I’ve actually really liked this way of trading.
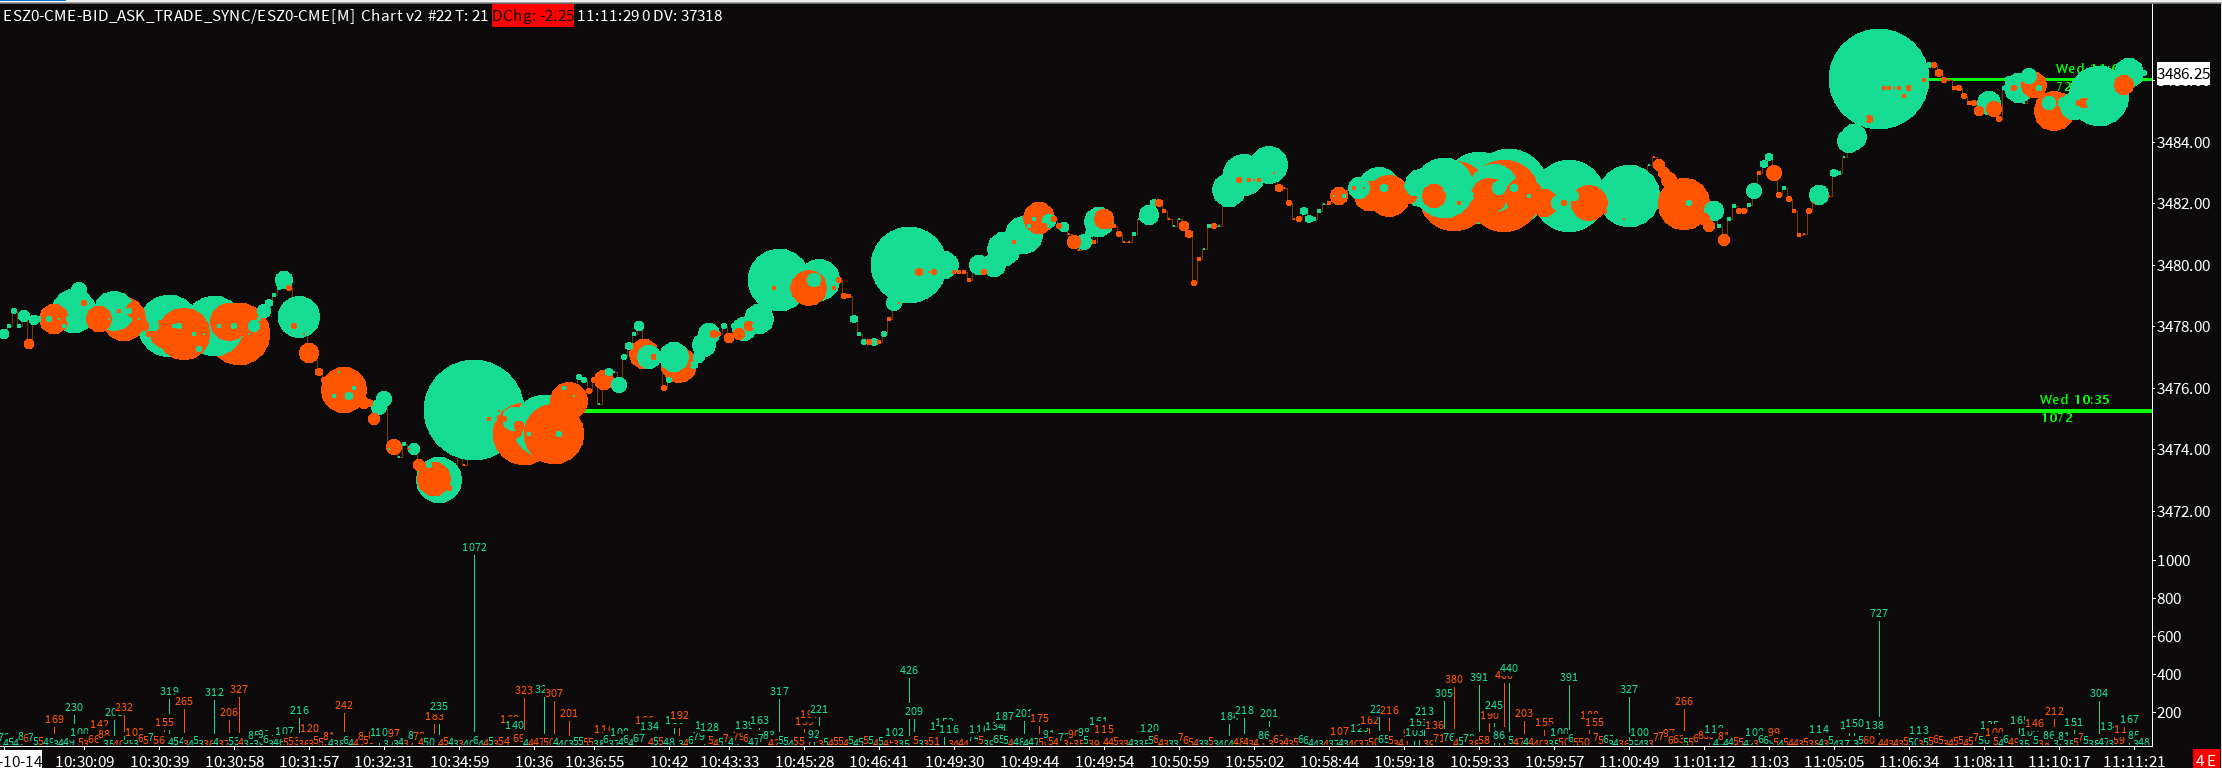
I don’t actually have an example right now that I remember, but let me, I think we can find one pretty quickly. There’s a couple of things right. So, let me take this one, for example. Maybe it’s not even a great example, but this person wanted to buy 100 lots and wanted to buy them right away. They had quite a bit of slippage, which means that there were not a lot of sellers on the other side of the market at that time, so the order book wasn’t super thick, and then we just flowed up. It gives me a good idea that this is not a terminal or a top essentially in the market at the time but rather that we’re going to see more continuation. So that’s a useful thing.
And then one thing you can do is, as you see these interesting orders, you can, what I do is I put a horizontal line. That way, as time goes on, I can see when is this person out of that position. And there’s no guarantee that this was an entry order. It could just be somebody that got stopped out, and then the market still kept going up. But, you know, you need to draw your own conclusions at some point. Let me see if there’s another. Okay, so this is actually interesting because somebody tried to sell, but then they were met with buying. Going back to the same example where there are sellers, somebody sold 563 lots, and it slipped five ticks. We did sell off a little bit, but then it came back down. And now, this order is in a drawdown as soon as we start moving up here, unless they started closing a little bit at a time, but that’s unlikely.
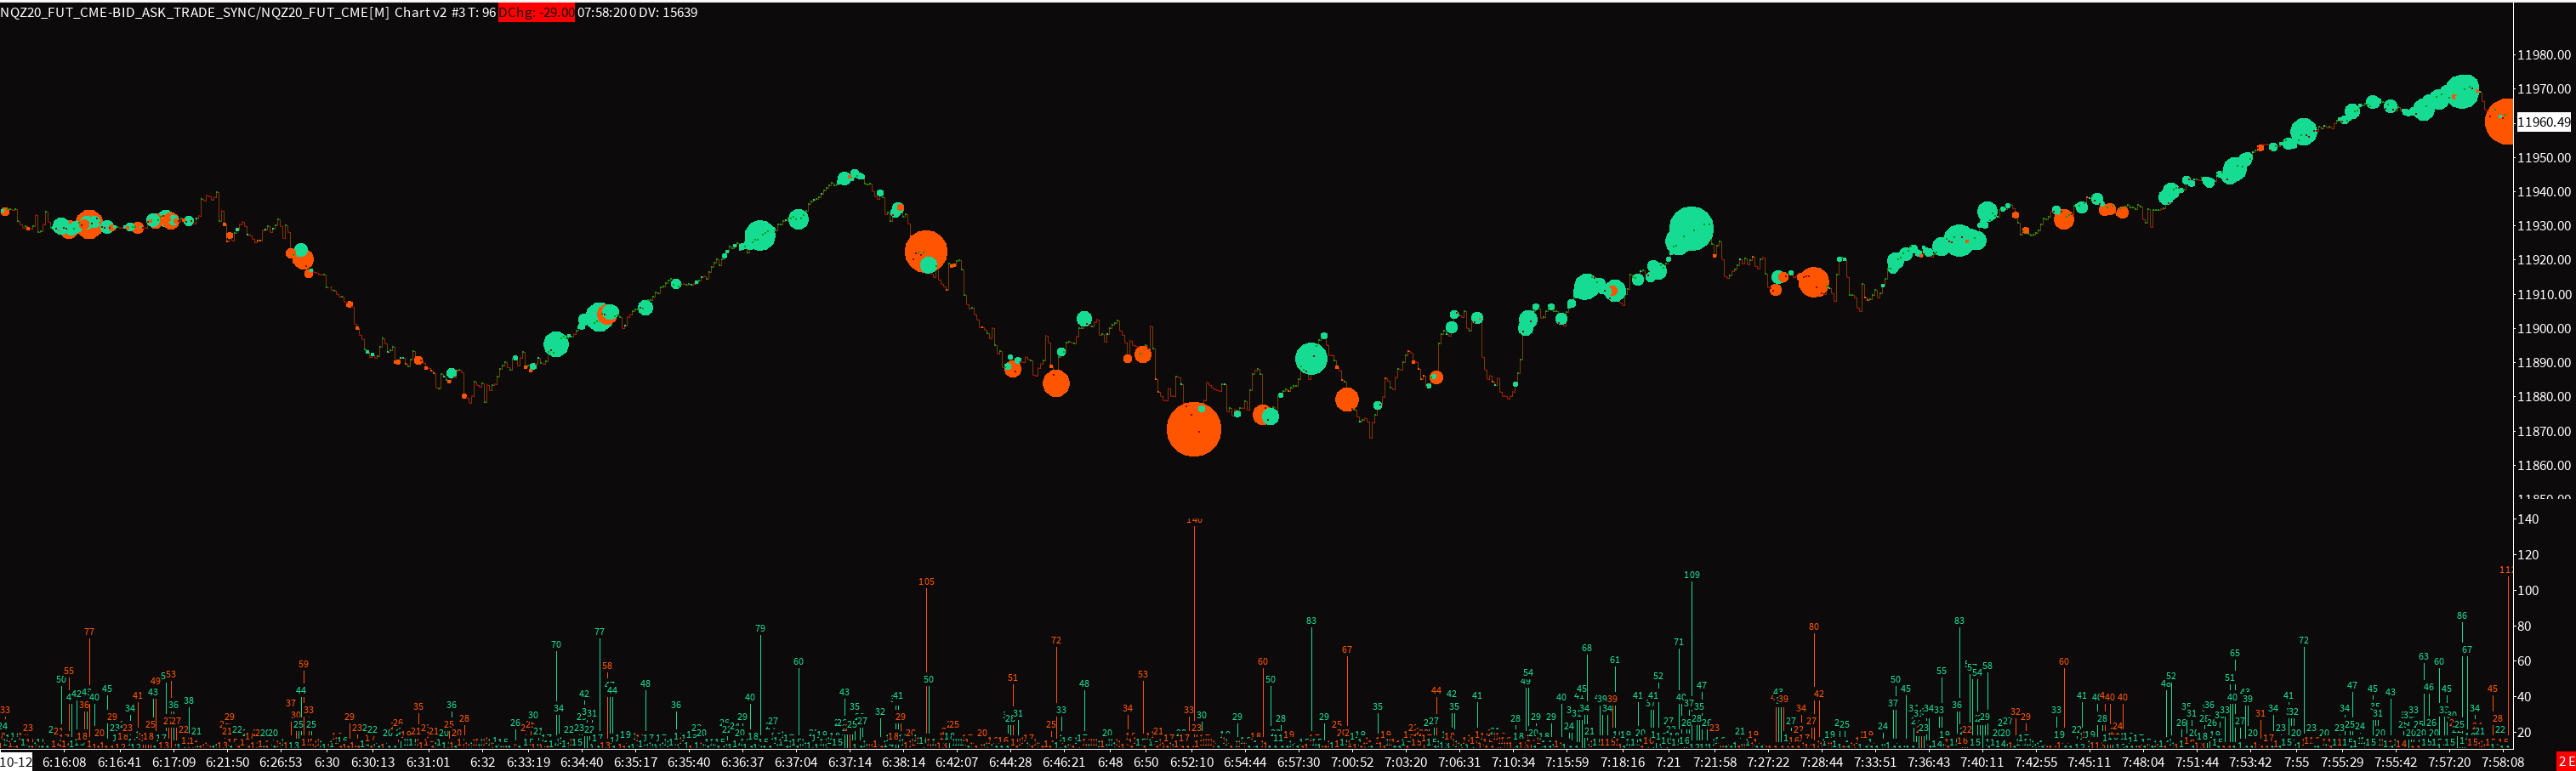
So, it’s possible as well that one of these other orders were them getting stopped out like this for 445, 411, which sort of matches this 560, not quite though. Sometimes you get them almost the exact same lot count. But what I was going to say is when you see an order like this, which is then met by another piece of order flow of the same size or larger, and then the market continues in that direction of that second one, it’s a good indication that this person’s not in or, in this case, sellers are not in control. You’ll find this to be the case over and over, and that’s actually been a. You have to be pretty patient because you see this order flow, then you see another one, and then you may enter even if it’s for a small scalp, but it gives you at least, it gives me good confidence. And I really only use that for the larger order flows, market orders. So let me see if I can find another one right here, for example.
So, a seller and then a buyer. I won’t go through it all over again, but you can see what I was talking about. Let me see if I can find one with a lot of slippage. I think there was one on Friday. So Friday news came out, and this was the news event right here. So, even though it wasn’t a huge order flow, but it was before premarket, you got slippage of 16 ticks, and the market just kept going. It just gives you a good idea again. What I would do is I just draw a line, and that’s my line in the sand from there on out. And you can just see how long it took. Not just because of that one order, but because that just becomes a level for everyone who’s watching.
I’ll leave this video here. I can find a lot more examples more than you want to listen to. So let me know if you have any questions regarding this, and hopefully, you like the new addition. Cheers