Sierra Trading offers a focused set of Market Internals studies for Sierra Chart designed to help traders assess real-time market strength, participation, and breadth—beyond what price alone can reveal. These tools are essential for gauging underlying market sentiment and confirming directional bias, especially during intraday trading.
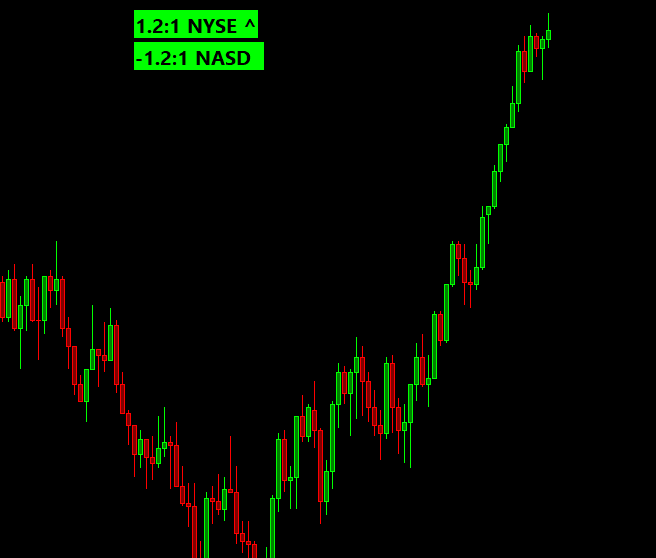
Breadth Bubbles
Breadth Bubbles provide a visual snapshot of market participation by comparing up-volume and down-volume for both NYSE and NASDAQ. Color-coded bubbles highlight whether buying or selling pressure is dominant, helping traders confirm momentum or identify potential exhaustion in real time.
- Ideal for tracking market strength across exchanges
- Includes trend direction logic for added clarity
- Designed for intraday decision-making
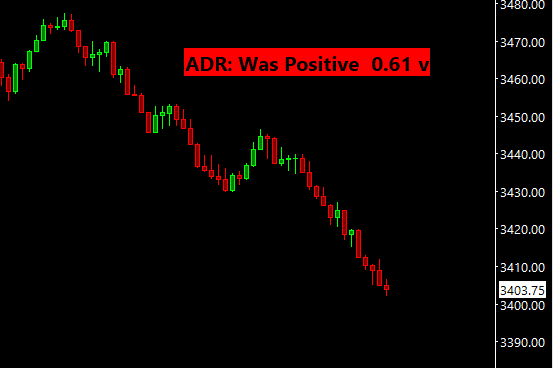
ADR Bubble (Advance/Decline Ratio)
This study displays the ratio of advancing to declining issues, offering a concise view of market breadth and directional bias. Color-coded bubbles indicate whether the market is in a bullish, bearish, or neutral phase.
- Detects shifts in sentiment during the session
- Highlights significant reversals or continuation zones
- Excellent for confirming price moves with internal breadth
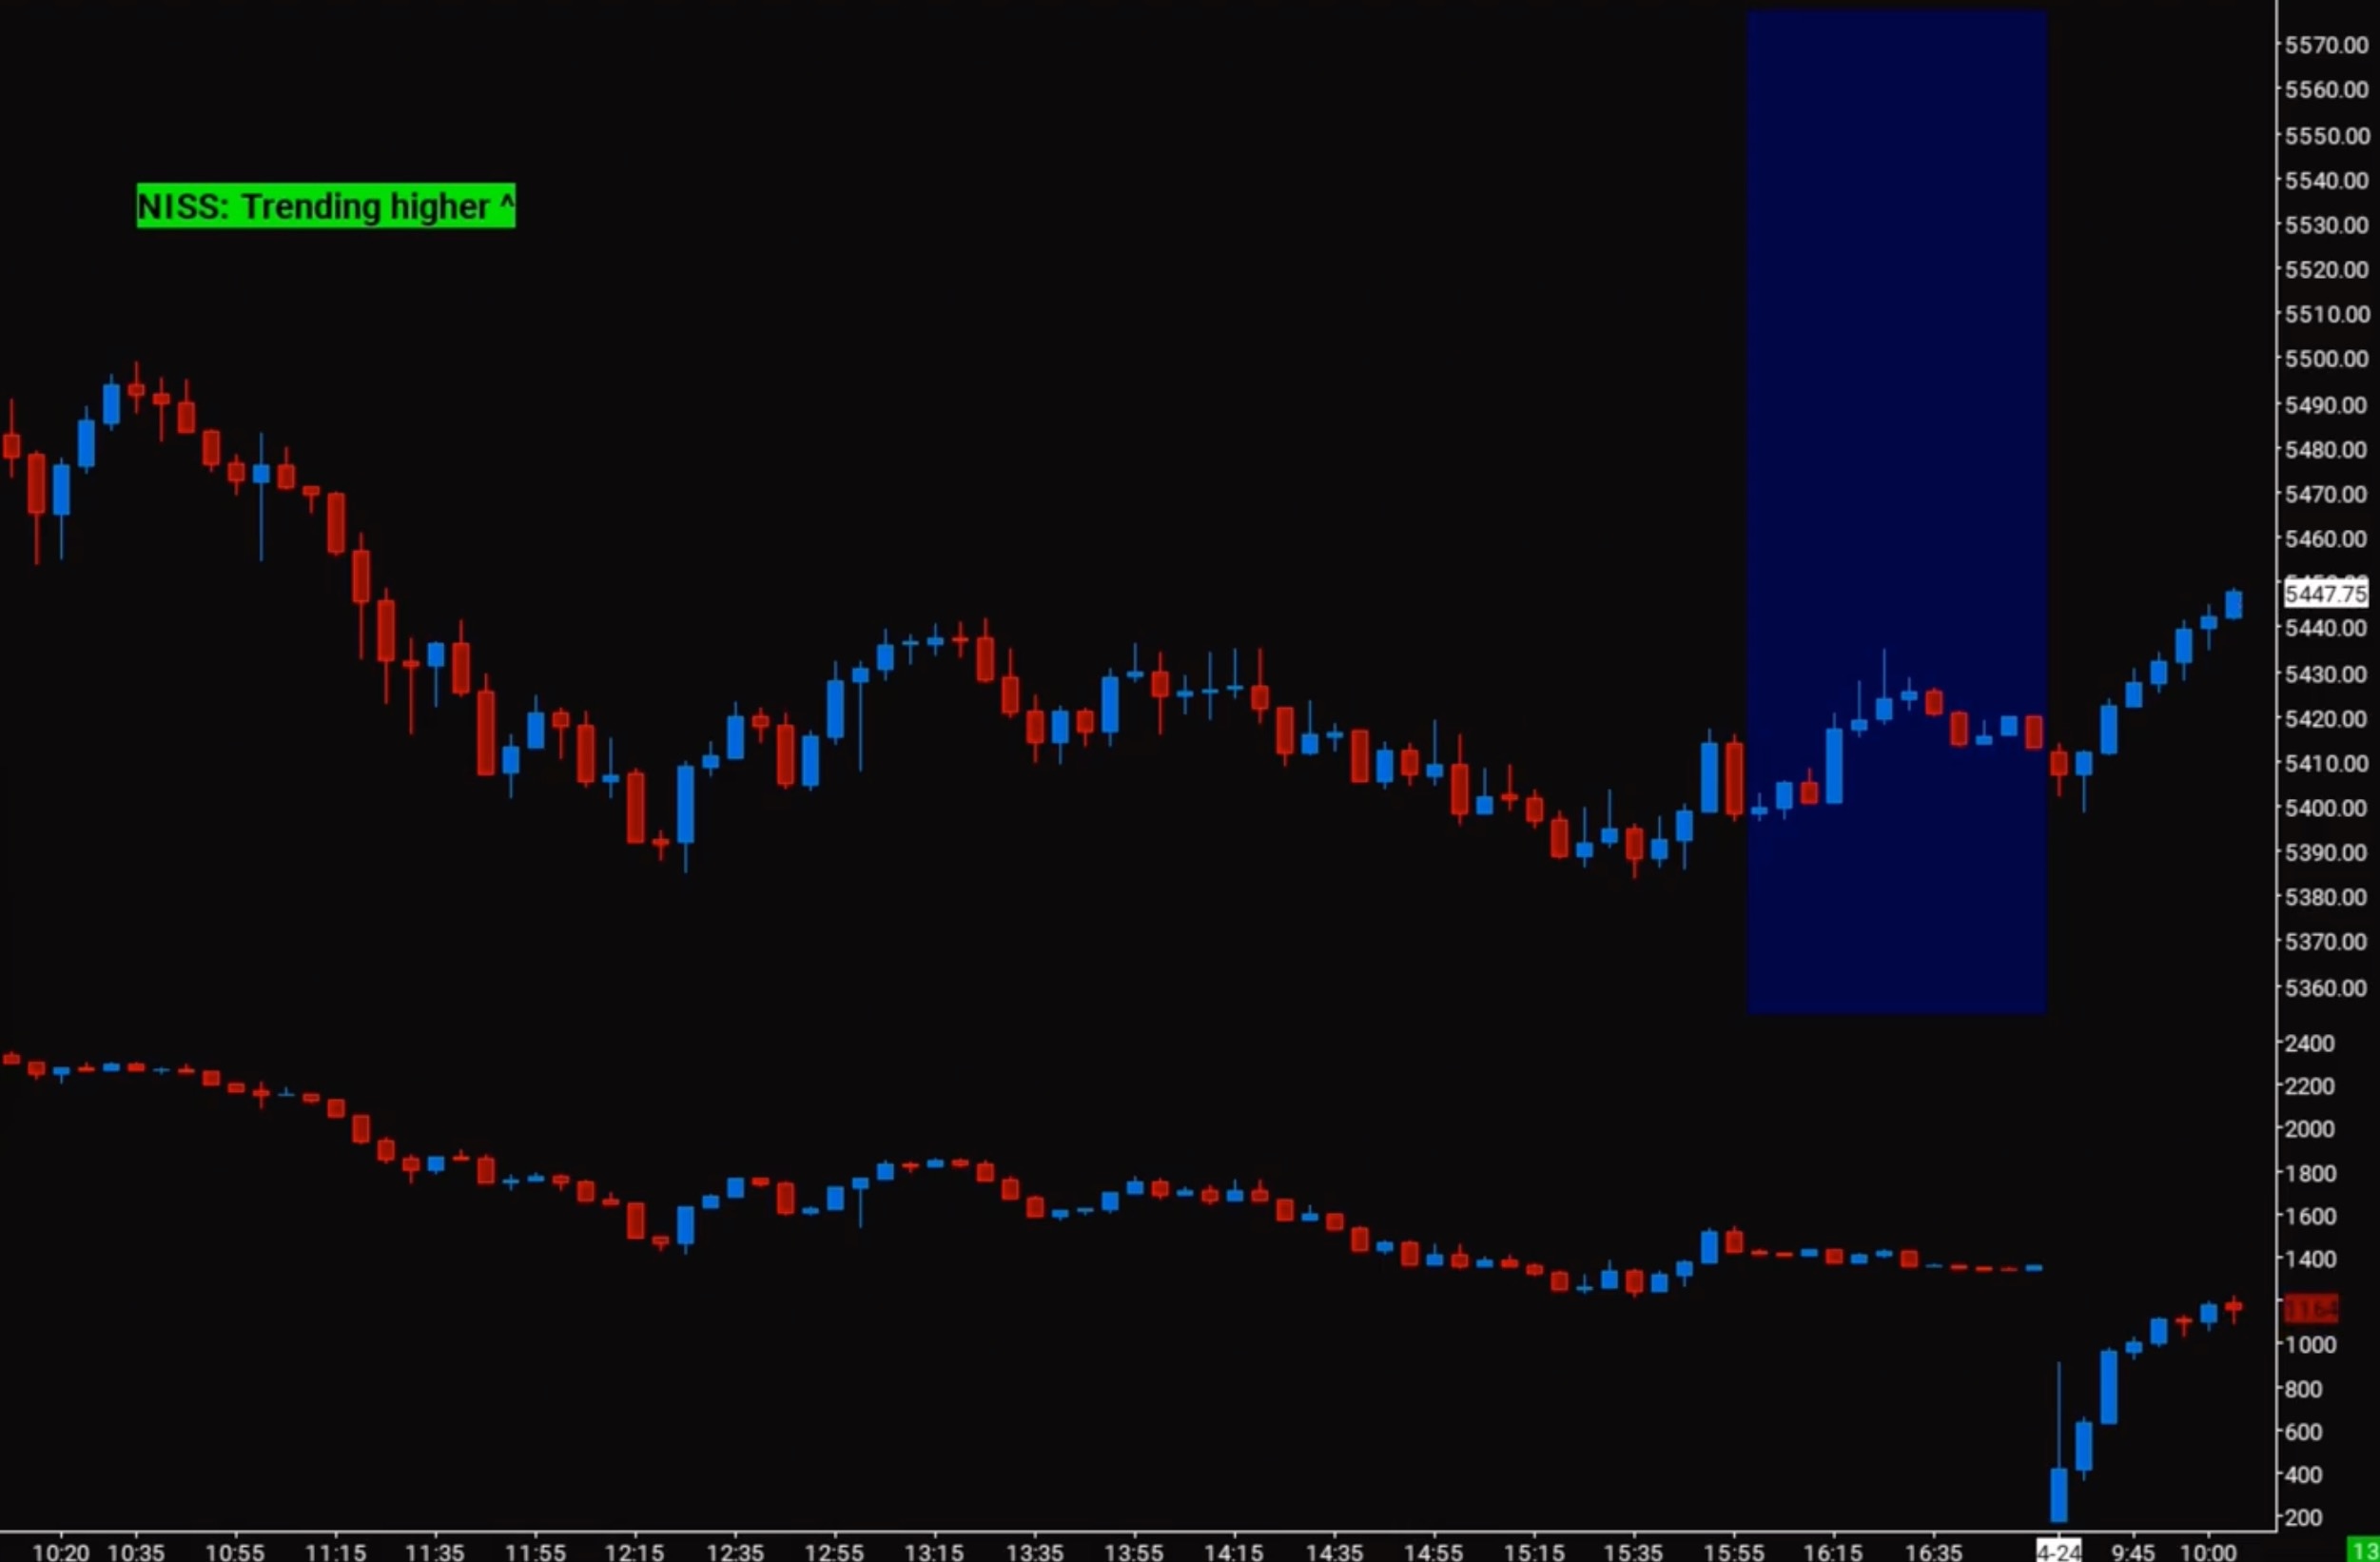
NISS Bubble (Net Issues)
NISS Bubble tracks the net difference between advancing and declining issues across an exchange. It visualizes trend strength, reversals, and participation with intuitive bubble markers.
- Helps spot divergence between price and participation
- Useful for detecting hidden weakness or strength
- Supports real-time trend confirmation
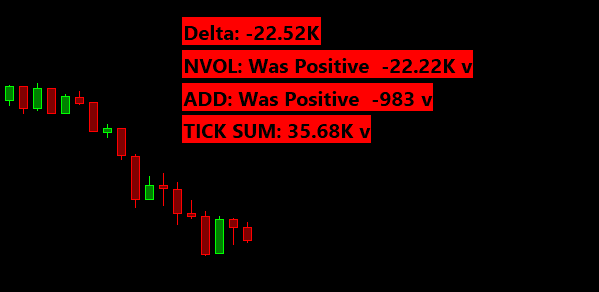
Internal Stat Bubble
This highly flexible study allows users to visualize any internal statistic or custom data feed as a bubble. It tracks the current value, its recent trend, and whether critical thresholds have been crossed.
- Fully customizable for advanced users
- Supports proprietary internals and unconventional metrics
- Ideal for integrating custom analytics into your charting workflow