The $TICK index is a powerful real-time sentiment gauge—and when used correctly, it can offer critical insight into market strength, exhaustion, and reversals. Sierra Trading provides a suite of proprietary $TICK-based studies built for Sierra Chart, designed to give traders a sharper, more actionable read on intraday market dynamics.
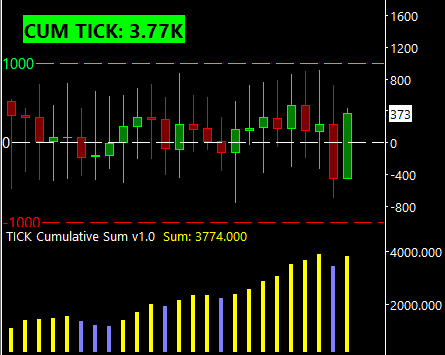
Tick Cumulative Sum
Purpose: Measures the net buying or selling pressure throughout the trading day.
How It Works: Each bar’s $TICK value is added to a running total, resetting at the session open. The resulting cumulative sum is plotted as a bold, color-coded histogram—offering a clear visual of whether bullish or bearish sentiment is dominating.
Ideal For: Traders who want to confirm the strength behind price moves and identify momentum shifts early.
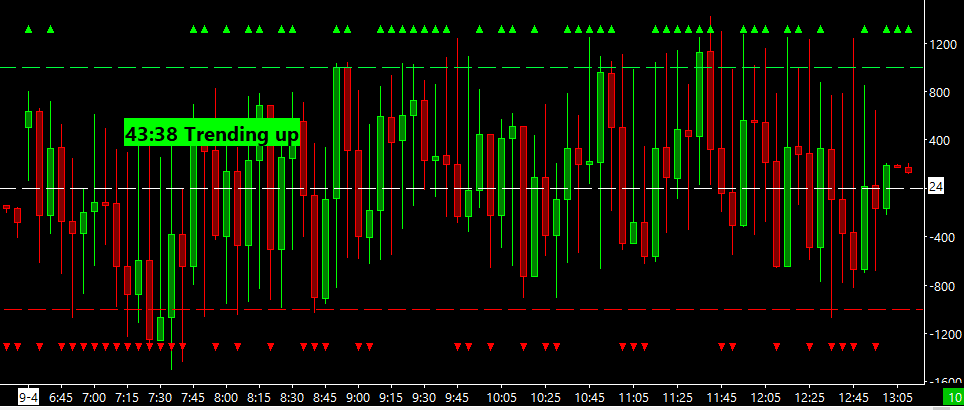
Tick Distribution
Purpose: Provides a visual breakdown of positive vs. negative $TICK closes.
How It Works: The study marks each bar with either an upward green triangle (positive close) or a downward red triangle (negative close), helping traders quickly assess the balance of buying vs. selling pressure throughout the session.
Ideal For: Intraday traders who want fast, visual confirmation of sentiment trends.
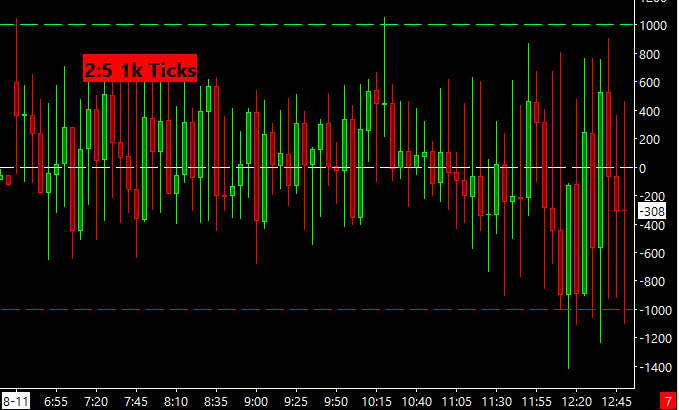
Tick 1k Count Bubble
Purpose: Measures market intensity by tracking large $TICK spikes.
How It Works: Counts the number of times $TICK exceeds ±1000 throughout the session, separating them into positive and negative occurrences. The bubble display summarizes this data, offering insight into volatility and directional conviction.
Ideal For: Traders who use $TICK extremes to anticipate high-momentum breakouts or reversals.