These Sierra Trading studies are purpose-built to identify high-probability trading opportunities—using momentum, volatility compression, and internal divergences. Whether you’re looking for breakout setups or intraday reversal zones, these tools are engineered to provide clear, rule-based signals.
Bollinger Squeeze
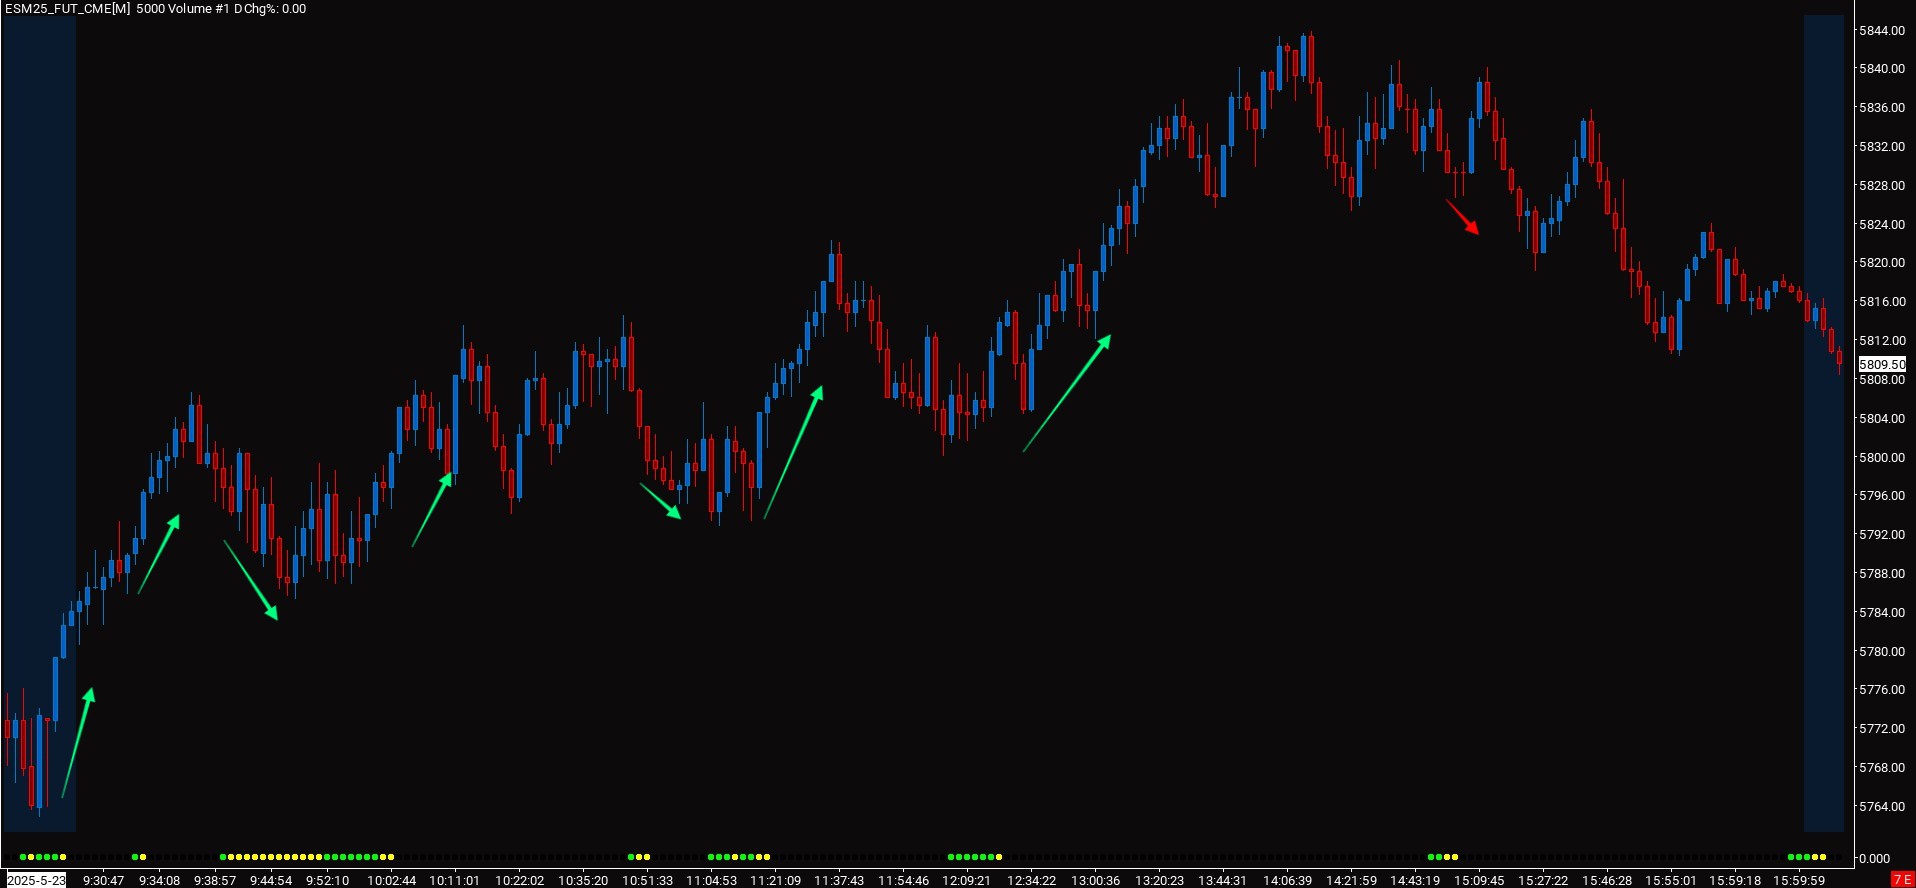
The Bollinger Squeeze study highlights periods of compressed volatility that often precede large directional moves. It tracks when Bollinger Bands contract inside Keltner Channels—marking squeeze conditions—and signals breakout potential as volatility re-expands.
Use this to:
- Identify pre-breakout setups with objective criteria
- Anticipate shifts from low to high volatility
- Time entries with visual confirmation of “release” conditions

The Pinch
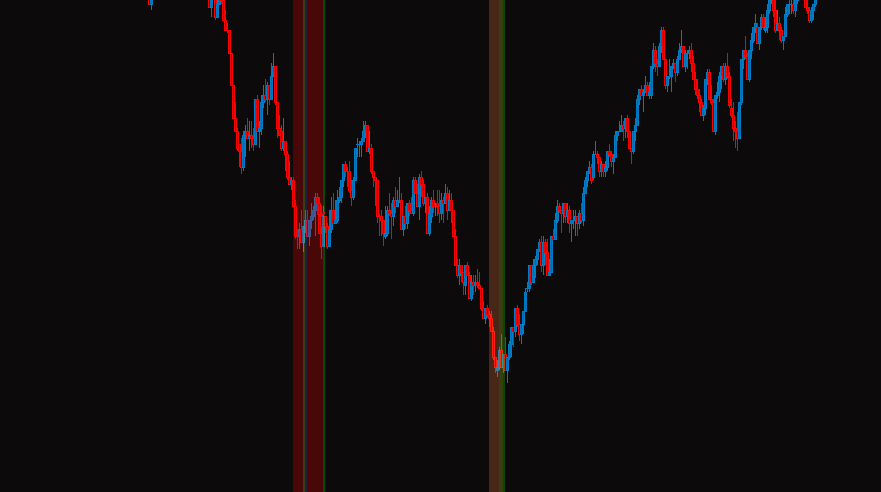
The Pinch study detects moments of compression and trend exhaustion by analyzing the relationship between MACD and ADX, with optional RSI filtering for added precision. When momentum tightens and conditions align, the study plots high-conviction long or short signals.
Use this to:
- Catch momentum-driven breakouts
- Identify exhaustion in strong downtrends
- Detect “pinch end” conditions to act on new market direction

Price Tick Divergence
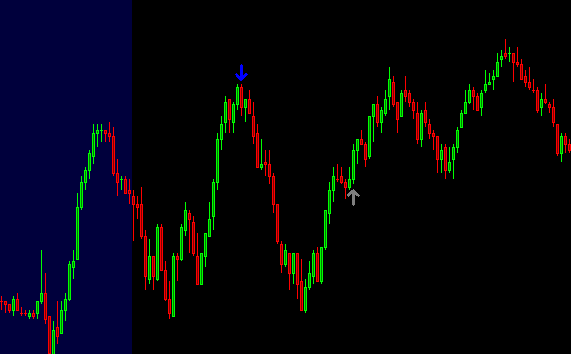
Price Tick Divergence identifies when price makes a new high or low but the $TICK index does not confirm, signaling a potential reversal. It classifies signals into Normal, Strong, and Strongest categories—giving traders a hierarchy of actionable setups.
Use this to:
- Spot intraday reversals with confirmation from market internals
- Quantify divergence strength and filter out noise
- Time contrarian entries with supporting breadth data


