Divergence Detector Delta
Below is the transcript of the video you’ll get access to with your subscription.
Hello folks, this is Ralph. And today I’m going to show you how to use that divergent detector study with Delta. All right. So let’s go ahead and add Delta to our chart here. And I like to use the cumulative Delta bars up/down tick volume, and then let’s open up the settings. What I like to do is have just a continuous flow of data.
So I don’t like to reset it at the beginning of each training day. So now you can see the data’s here and it’s just a continuous flow. It doesn’t reset to zero at any point in time. There’s actually another study that I like to plot on this sub graph right here that will plot a line right at the opening of each session.
So you’ll have a line going from here to here and then a line going from here to here, and then it’ll pop up because this new session opened right here, the overnight session, as you can see by the blue background, and then we’ll have a line, just plot it until the next RTH session. So that’s how I like to use it.
So anyway, let’s go ahead and add the study itself, the divergence detector study, and then we’ll open up the settings. We’re already pointing it to the right data here, but we want to make a few changes to a few of the inputs. So the halfway Mark is actually going to be just zero. It doesn’t really matter so much for this study.
And then you want to change the minimum maximum look backs for both the shorts and the longs that the algorithm looks for. So for the first one you want to do negative. And I like to just do a big number right here. For the maximum you’ll want to do the same, but you want the number to be positive. You can just copy and paste this number.
So it’s always the same. And then here you want to make this one positive and this one should be negative. All right. So now that that’s set up, the next thing I like to do is. Change a few other of the requirements. So I don’t like requiring that it’s at an extreme, so I set this one to know, and then I also change this condition from yes to no.
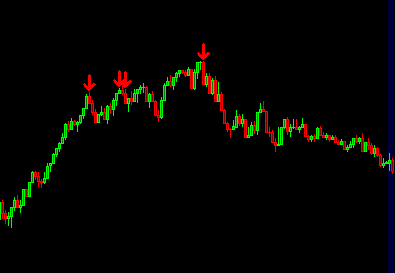
Because I like to know immediately rather than waiting for the next candle to plot that divergence. So let’s go ahead and hit apply, and now you’ll see all the divergences being plotted. So that last input that I changed would move this arrow from plotting right here to right here. To the next candle, essentially.
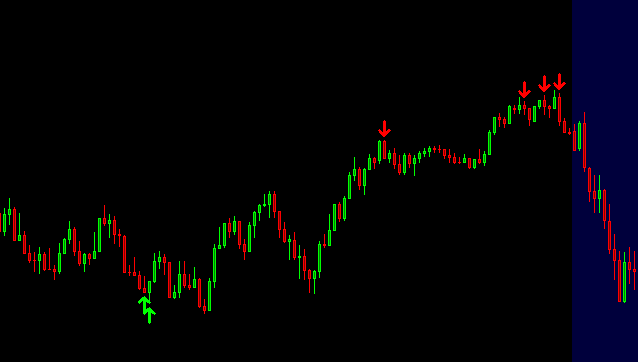
So I want to know as early as possible. Unfortunately, sometimes that input causes things like this over here, where old just continuously plot over and over. And you just need to know that that setting is going to put you in that position, but rather than plotting and narrowed down here in this candle and this red candle, it plots them right away.
Right. Otherwise they would just wait until this occurs and then it plots the error. So it’s completely up to you. This is just how I like to use it. And this is essentially just the setup. Um, if you haven’t already watched the RSI video on how to use it, go ahead and watch it. I traded basically the same way.
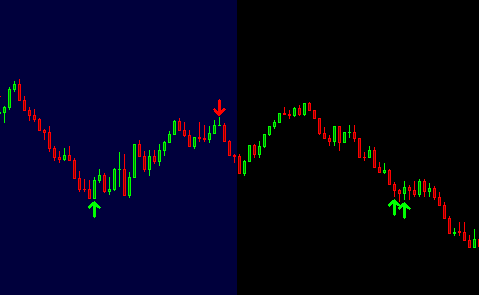
Sometimes I don’t put the stop right away. So as you can see, because of the settings that I use to run just a little bit longer, so sometimes I’ll give it a longer leash. But it just depends on trade to trade. That’s not always a good idea. So, I mean, if you want to play it safe, you’ll want to put the stop right above the high.
And you know, maybe you would have gotten run over a few times through here, but eventually it would have worked out and it would have worked out nicely. And then other times, like, for example, I think those settings that would change from yes to no actually made this alert appear. Otherwise I don’t think this one would appear so.
Again, it just depends. And I just prefer like this for Delta. I just want to know right away when Delta is diverging. And I know that maybe I won’t enter into the trade right away. I’ll just wait a little longer. I hope this was helpful. I mean, what I would recommend doing is just going through the data and seeing how it plots.
Change the settings around to see what works for you. But one thing that you’ll want to do is at least change those numbers so that it’ll plot correctly for the Delta’s data. All right. So I’ll leave it at that. And I hope you enjoy the study until next time everyone, happy trading!