Divergence Detector MACD
Below is the transcript of the video you’ll get access to with your subscription.
Hello folks, this is Ralph. And today I’m going to show you how to use the divergence detector study with MACD, if you haven’t already done. So please go ahead and watch the setup video with RSI so that you can understand what the different inputs mean that we’ll go through today. So let’s go ahead and add MACD to our chart here.
Now, if I hit apply, you’ll see it as a sub graph down here, and then let’s add the study itself. And then we’ll point it to the right data. I like to use the MACD but you can use the MACD average, the moving average for the MACD which is the purple line that you see over here. And then you have to change a few of the different inputs because the study itself has configured for RSI.
So you have to change a few things to make it work with MACD. So the halfway Mark is going to be zero for MACD as you can see, actually has the zero line, whereas RSI 50, and then these four next inputs right through here, we need to change as well. So I like to use. Um, either three or two, we’ll change the inputs around a little bit later, so you can see how it changes the data.
And then you can select five from here and then you just need to do the inverse here. So negative three and negative five. And then what I’d like to also change is required the extreme on loock back candle from yes to no. All right. So let’s go ahead and apply this to our chart. And then let’s see if it plots anything.
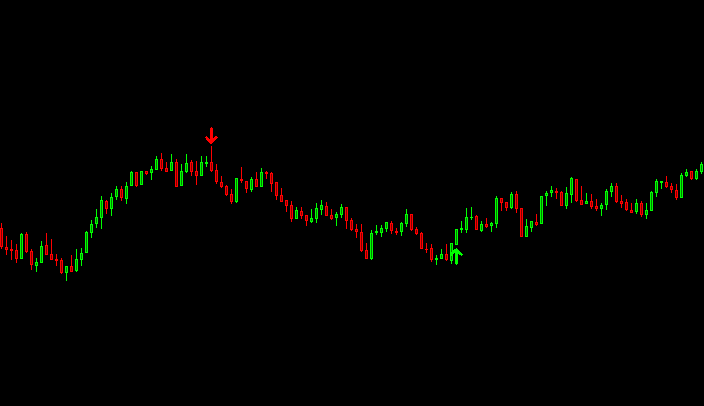
MACD plots a lot less than Delta or RSI. And there’s actually one right here. So as you can see, it’s very, there’s very few cases where plots, if any, and there may be others, but let’s just not spend time scrolling around. Instead, let’s go ahead and change some of the inputs so that we can get some more plots.
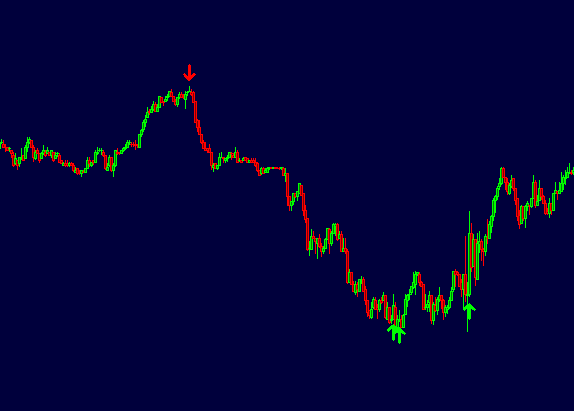
So just for fun, we’ll make the settings or like the conditions here are very loose. So instead of setting three or requiring three, for both positive, negative four, change it to one. And again, please just watch the set of videos so that you can understand what these mean. So if I set it to one now as expected, we see more plots here and you’re also gonna get a lot more plots that are going to be false positive.
So you get a positive alert, but it’s a false one because price just keeps him moving through it. Not that others would necessarily work, but with stricter conditions, you’re going to have a higher probability of the alerts working out. And as you can see here, you’re getting your entering, getting stopped off, entering in and stopped out and then eventually works and works nicely.
So it just depends, you know, there’s just a bunch of different cases. What I would recommend is for you to play around with the. The different inputs so that you can get the alerts, how you would expect him. And potentially you’d like to see more alerts, but maybe you’ll choose who’s on your own with your own discretion as to which ones you take.
So let’s go ahead and change the inputs a little bit again, we’re going to add a moving average here to add the water falling detection. I don’t necessarily recommend that you add this to the MACD but you can, and we’re just doing it just to show you how it works. So I like to either use 12 or 14 as the value for the moving average.
So if I add it now, you can see the moving average going through price. It’s supposed to be a fast moving average. I’ll go ahead and hide it.Because I don’t like to look at it and then we just need to add it to the divergence detector. So add it here and then let’s select it from the list. That’s the wrong one.
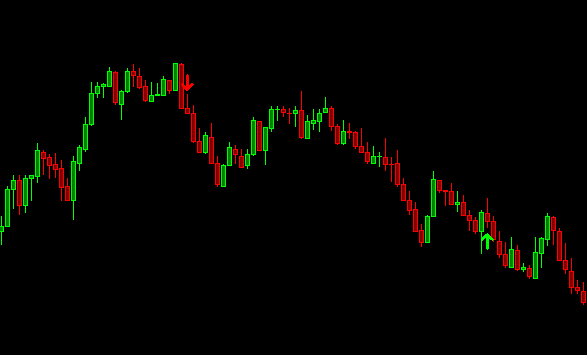
There we go. And then I like to use usually about 15 or 20 for the slope. So let’s go ahead and apply it. It should remove some of these plots. As you saw. As I hit apply, I removed one of them right here. Might’ve also removed some of the other ones. It’s hard to tell, but in my might’ve, I don’t know, I might’ve removed another one here, clearly removed another one here, which was.
There was two good shorts right through here. So it just depends. Let’s go ahead and change that back so that you can see how it changes the data over here on this day. So instead of using it and we’re gonna remove it, hit apply. Now you can see these two being added again, like I said, it’s not something that I would add to MACD, but you can, and then what I like to do is change this from one to two. And I think now we’re going to get good data here. You’re still gonna get some of these that are not ideal. There were a few here that got removed. This one still wouldn’t work, work out so well. So it just, it’s a little different with MACD. I know some folks like to use it and have asked me about it, so. Here’s the video for you. If you want to set it up and you can go ahead and add it to your chart. So, I’ll leave it at that. And until next time everyone, happy trading!