Below is the transcript of the video you’ll get access to with your subscription.
Hello folks, this is Ralph. And today I’m going to show you how to set up the divergence detector study. We’re currently looking at a 5,000 trade chart of the e-mini S&P. And all I’m going to do is I’m going to add RSI as the base data. And then I’m going to add the study itself to detect the divergences between price and RSI.
All right. And then we’re going to go through all the inputs of the study so that you can understand what they do. And then we’re going to leave it at that. I’m going to create other videos that we’ll go over, how to set up that divergence detector study for our RSI and Delta and Macd and how to use them.
So you can watch those later. All right. So let’s go ahead and add our RSI to our chart here. If I hit apply, you’ll see the sub graph being added down here. And now we’ll add the divergence detector study. We’ll open up settings here just to make sure the data is pointing to the right data here. And, you know, you need to feed it the data from whatever base indicator you want into the study.
So just select our RSI from here. If it’s not already there. And I use RSI average. You can try our side by itself. It’s completely up to you. You can figure out whatever you like. Again, the study is super flexible, so you can do a lot of things with it. So if I hit apply now, you’ll see these arrows added to price.
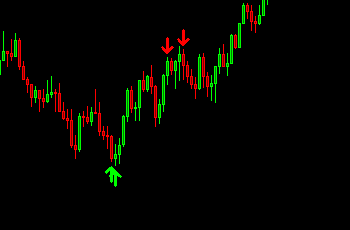
Right. And essentially, you know, it’s comparing the high here to the previous swing high, and then it’s looking at the values for both of these bars on the RSI. And then it’s saying, well, okay, we had a higher high here in price. And then the value for our RSI was 75. And then in the future, we had a higher hind price, but a lower high in RSI.
And because of that, now we have a divergence and this is why it plots the little arrow pointing down. All right. So now let’s go over the inputs and we’ll go through them and update the charts that you can see how the arrows change as we made changes to the study. So let’s open up the divergent detector and I already went over the first input.
Just make sure you’re pointing to the right data. The next input, it asks you what the Halfway Mark is for this underlying data. So if we’re looking at our RSI, you know, RSI’s values go from zero to a hundred, can’t have any higher value or any lower value. So therefore the halfway Mark is 50 for other studies, for example, Delta, the Halfway Mark for Delta will be zero.
So just make sure you update this input to match the indicators data. All right. The next input asks you which data you want to look at for each bar of price. So right now it has the high for each bar selected. So when we’re looking at these two bars, as we just talked about, we’re comparing the high value.
For each bar, but you could also compare the close or the high/low/close, average, you know, whatever you want, feel free to play around with this, but it defaults to the high and same thing. When we’re looking at divergences on lows, it’s looking at the low value for each candle. All right. So hopefully that explains that. The next input asks you what you want the lowest value to be for the lookback candle.
So let me just close these windows. And if we look at this example, I moved over here to the right, some more. In the inputs. I refer to these two different candles as lookback candle, which is going to be the one that we’re looking back to, meaning it’s a previous swing high. And then the candle potentially going to be plotting and alert for is going to be the alert candle.
Okay. So look that candle is over here, likely this red candle right here, and then the alert candle, which is going to be this green bar right here. So going back to chart study settings. You’ll see that, that theme or that verbiage play out throughout the different inputs. So if we’re looking at the look back candle, this input is asking you what you want the minimum value to be for the short.
So if, again, if I close this and we already saw that that value is 65, there this lookback candle, the value for the indicator. Down here for our site needs to be at least 65 or higher. So right here, right around here. Right. And it is right. It’s likely around 76. So now if we go back to chart study settings, The next emperor asks you what the maximum value for the alert bar can be.
All right. So again, the alert bar is going to be this screen candle right here. What can be the maximum value in RSI for that alert candle? And I just have it set to 80. You can change it again, whatever you want, but it requires the value to be lower than 80 right now for the short. And then on the long side, we haven’t looked at any green arrows, but let me just scroll over here to the left.
So right here is a green arrow that would give you the indication that you could take a long here. Okay. So if we open up charts, study settings, So these two inputs are going to be related to the long, again, the lookback candle, what can be the maximum value for that lookback candle? And then on the other handle, the alert candle, what can be the minimum value?
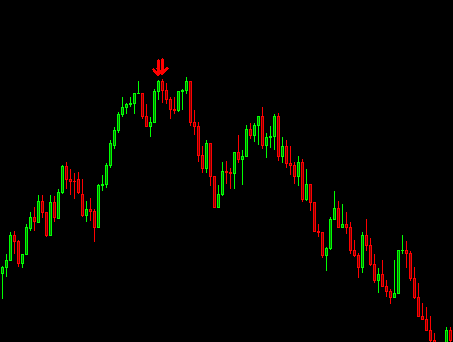
So you want a value that is higher than or equal to 20. Okay. So hopefully that makes sense. The next input asks you, if you want it to look for double divergences to the algorithm can find back to back divergences. And those are likely to be of higher probability of working out. So let’s go ahead and find one here on the chart and they actually plot as bigger arrows.
So here we go. Here’s actually too. So you have this divergence that was detected right here. And then another one that was detected back-to-back from that previous one, and that is the requirement, right? We need a previous divergence first, before we plot a double divergence and it comes in the form of just a larger candle.
This one would have worked out really nicely. Again, they’re just higher probability. It doesn’t mean that they’re going to work out, but they’re likelier to work out. So going back to charts, study settings, if for some reason you don’t want to show these double divergences. You can just click no for this dropdown and it’ll remove them.
All right. So the next input asks how many bars you want to look back to look for higher, highest, or lower lows. So right now we have it set to 30 and then the lookback from is set to three. So if I close this. And we look at this alert, that plotted right here, what it’s going to do first, it’s gonna start looking back from three candles from the possible alert candle, which is going to be this one right here.
So it’s going to go back one, two, three, and then from here, it’s going to look back 30 bars to look for a previous higher high. And then it’s going to likely find this one or this one. I’m not really sure how many bars are right through here, but it’s going to find the previous swing high. And the reason why it starts looking back from 3 bars before the possible alert bar is that I found that if I did this, it removed some of those false positives that were plotting, but you can always change this to zero if you want.
So if you want, you can go. And change this three to zero, and then I’ll just start looking back 30 bars from, you know, the current bar that it could potentially plot in alert for. We actually didn’t really see a change in here as the data would have been exactly the same. I guess the minimum is 1. So you can play around with it and see how it changes the data and the alerts for you.
The next input would require an extreme reading on the indicator data. So right now I have it set to yes, which means that. The look back candle for the RSI, meaning the underlying data would need an extreme reading on this. Look back candle. So say if found the previous swing high as being this bar right here, it would require the study, the indicator itself to have the highest high in the last 30 bars, which in this case we can easily see that it is the case.
Right. But if there was a previous higher high on RSI, say right here, and then this one was plotting somewhere lower. It would never plot this alert. The lookback candle for the indicator needs to be the highest high within those look back candles. And again, we’re adding all these different conditions to prevent false positives from showing up.
So we’re stacking all these different things on top of each other and filtering the best alerts to plot on the screen. Because if I were to build a study that just looked for divergences, blindly, you’d get a ton of plots. And then the study would essentially become unusable. It would give you so many false positives that you would never want to use it.
So let’s go back to chart, study settings. The next input asks, if you want to wait for a future condition, what this does is it keeps track of a divergence that occurred. So if we look at it, you know, the same example all over again, we had a previous swing high compared to this candle right here, but we didn’t plot the alert on this candle on this red candle right here.
If I switch this over to no. You will see that likely this alert moves from this candle back to one of these two, either the green one or the red one. So let’s check it out. It actually plotted out both and sometimes this can be advantageous, but let’s go ahead and look at the chart data. Once more, you can see that plots a lot more alerts than there were before.
You can see these buyer alerts as well right here. So one thing that I’m doing again is I’m filtering all of these alerts into less alerts that have higher probability. Sometimes they give you a worse entry, unfortunately, but sometimes they actually give you really good entries and it filters out a lot of really bad alerts.
So it’s a matter of preference. Right? So going back to the chart study settings, if I flip this back to yes. You’ll see that I have these three conditions down here and, and flipping the switch back to yes, enables these three conditions. And these are also toggles. So you can toggle these conditions on and off, depending on which ones you want to add.
And this is just a stack of conditions, right? All of these different inputs are just adding to the stack of conditions to filter the best alerts for you. So if we go back to this example here, That divergence, as you already notice was triggered at this green and red bar. So both of these are being tracked now by the study.
Meaning there was an alert right here, but it’s waiting for all of these other future conditions that you have set to. Yes. To also be true and they need to be true at the same time within the next five bars of the last diver that was detected. So hopefully that makes sense. Right? So our divergence was detected at this red bar right here.
So that means that within the next five bars, wherever price goes. These other two future conditions need to be met five, turn this, it went on as well. Then those three future conditions need to be met all at the same time. The first condition is going to require that price is, is making the highest high within the last 30 bars.
So if you remember. When I turned the conditions off an arrow plotted in both this green candle and this red candle, because this condition requires price to be at the highest i, it wouldn’t negate the alert that appeared in this green bar, because as you highcan barely tell, well, the red bar made the highest high.
Thankfully there was an alert also on that red candle, but now the green candle is invalid. And now we’re just looking. At the alert of this candle right here of the red one, which, which did make a higher high. So therefore this condition so far is true. The next input requires the indicator to reverse direction.
What will happen sometimes is that price will reverse in the case of short. But the indicator itself will continue making higher highs. And then what will happen is price reverses. And then it continues making higher highs. So again, this condition just filters some of those cases and it requires the indicator to now be making lower lows.
So if we look at the data for what the indicator looked like at these two different candles, and I’ll just zoom in so that we can see it a little bit better.
You know what this candle, like I said, we made a higher high than this green candle, so that one was invalid. And then we closed on this candle lower than the previous candle. So therefore plotted the alert. So because of the requires a confirmation of this red candle to be the highest high. It’ll never plot the alert on that candle.
It requires the candle next to it to be lower high than this red candle that we’re on right now. And it also requires RSI to continue to make lower lows. And because this candle right here meets both of those criteria, you know, it’s not clearing this high right here. And the RSI is making lower lows.
It can go ahead and plot the alert on this candle. You can also see it over here. This alert where even though this didn’t really make a higher high, because it’s at the same highest as previous candles, they can still consider it as the highest high. And then this next candle meets all that criteria that we were just talking about.
And then it can plot the alerts. Usually when you get a little cluster of divergences like this, there’s got to be a good trade. Alright. Going back to the charts study settings. The next condition actually requires the indicator itself to make a higher-high or lower-low than was previously made. It actually requires the indicator to be higher than a certain valve.
I don’t like using this one this much, but it’s actually not too bad if you tweak it correctly. So it’s simply saying that if we’re wanting to plot a short, it requires our side to be higher than 70 in this case. Or if we want to plot a long, it requires our side to be lower than 30. Alright. So the next input asks how far away you want to plot the arrows in ticks from the high or the low of each candle, where an alert is made.
So let me just move these windows that you can see it change. So right now it’s plotting four ticks away from the higher or the low in this case, the high, which is what we’re looking at right now for the shorts. But if I changed this to eight, so if I double it and hit, apply the arrow, simply move up. So it’s a very simple input to describe.
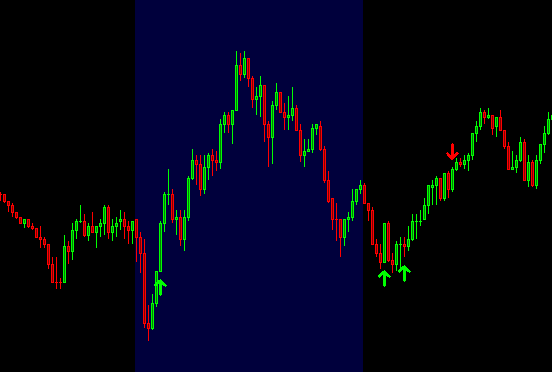
The next input allows us to prevent alerts from showing up whenever price is water falling. And let me see if I can find a second example here on this chart.
Not sure if we had a really good down day,
but you can do it in both ways. Right? So for example, here were water falling down. And here we’re kind of water falling up. And even though it’s plotting these divers, because RSI itself it’ll pull back. Right. And you want to be able to tell them, you know, there’s this area, has it bid, people are buying.
There’s just no reason to be planning these. So with a fast moving average, you can accomplish this. And we’re going to go ahead and add this now. So. Let’s go back to chart study settings, and we’ll want to select a moving average. I just like to do a simple moving average
and let’s just do 14. So now you can see how price isn’t really crossing this fast, moving average. Right? So this way we can detect that we’re water falling. It’s a very simple and almost naive way of detecting this, but I’ll actually remove a lot of really false plots. So now if he’d go back to the divergence detector, we can link these two together.
So we’ll select to use the moving average, and then we need to point it to the data of that moving average that we just added. Alright, so the next few inputs get a little complex. The first one, just to see if any of the candles have closed above or below, depending on which side are, we want to plot the alert on if they’ve closed above or below that moving average.
So I just have it set to 9. So that means that within the then candles did we have in this case right here for this long, did we have a bar that closed above the moving average? And it looks like we might I’d of, if we really zoom in here, this green candle might’ve closed. Above the moving average, but in the case here for the short, did any of these bars close below the moving average?
It doesn’t really look like they did. The next two inputs are the ones that can detect if we’re water falling. So at what degree of an angle would you consider a waterfall to be occurring? So for example, is a 35 angle steep enough, or do you want it steeper? So for example, we could do 15 and then the length to look back, to find a bar, to be able to calculate what that angle is.
So it’ll look back to the bar 12 bars ago. And then it’ll grab the value for the moving average for that bar and the current value for the moving average. And then it’ll calculate the slope. And then if the slope is under this value right here, which you have set to 15, then we’re water falling. And then it also checks to see if the closing conditions for the bars has also been met or not.
Alright. So now if we had apply my guess is that these alerts will go away, but this one will stay because we actually closed. Above this moving average. So let’s go ahead and hit apply here.
And as you can see, these alerts got removed. This one stayed, but I believe if we go ahead and change the moving average to be, I don’t know, 16 here. Now this alert gets removed. So again, there’s a bunch of different levers that you can tweak to optimize potentially this study, but it really depends on what you like and you’re going to potentially get more false positives.
If you want to be more loose with your settings, So I’ll switch this back over to 14.
And then the last input essentially just asks you if you want to have an audible alert, whenever one of these alerts plot. So whenever a little arrow will plot, you can select any of the sounds available to you in your Sierra Chart. And it’ll play that alert through your speakers. And that’s something that I find super helpful.
I think I’m going to leave it up. That’s usually how I like to look at this chart is without the moving average. So I’ll hide this moving average, and sometimes you don’t even need to look at the RSI. So I’ll also hide the RSI and I’ll look at the chart as cleanly as possible so that I have the least amount of distractions.
And if I zoom out, you can see, you know, sometimes. Like any other study, you have ones that work out really beautifully, where you get huge shorts and other times where either you get a little bit or you may get stopped out and then the move will happen. So it just depends. And it’s really up to the trader to determine the best setups for him or herself.
So I hope you found this useful, and hopefully you can find a way to incorporate this into your trading. So until next time everyone, happy trading!