Below is the transcript of the video you’ll get access to with your subscription.
Hello folks, this is Ralph. And today I’m going to show you how to use the exhaustion detector study. If you haven’t already done so please go ahead and watch the setup video as it’ll teach you how to set up the study so that you can get the same that we’re looking at right now in your Sierra Chart Instance.
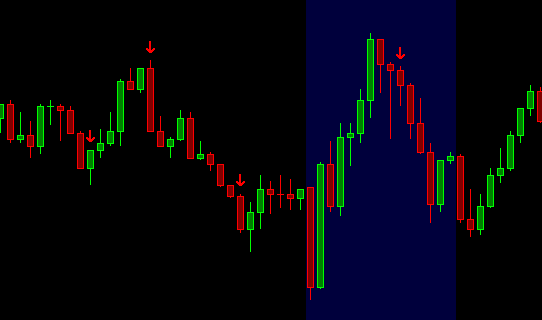
So right now we’re looking at a 5,000 chart e-mini futures, as you can see right up here. Yeah. And normally I don’t like to go any lower of a timeframe for this kind of study, otherwise you’ll just get too many alerts and too many false ones at that. So I like a higher timeframe. Even at 20,000 timeframe, which we’ll look at in just a minute.
So how I like to trade this is to wait until the next candle from the one that the alert plotted on to enter into the trade. So if we look at, we’re going to look at this trade over here that didn’t work out and this one that did work out. So let me just zoom in a little bit here. If you see an alert right here, you’d want to wait until this candle, the one adjacent to it, to the right, to enter into the trade.
And then you ideally want to get in as close to the top as possible. Once the top gets taken out, your trade is no longer valid and you need to get out of that trade. So say you would enter somewhere along here, your stop would be. About two and a quarter to two and a half points depending on what you want to do here.
And then for example, this one that doesn’t work out. I first off likely wouldn’t have taken this trade because the candle itself closed at the very top of this candle. So I would wait until the next candle and then really see what happened. And then this alert wouldn’t have plotted until this candle was at its high.
So you’d want him wait again until this next candle closes and then you’d enter the trade as close to the high as possible. And I think for this case, I would have gotten stopped out anyway. So if you got lucky enough to get in somewhere around this area towards the top, you would have a stop of about 2 points, to two and a quarter or even two and a half points. So that is your, your risk. And obviously your reward is large, but I think in this case I would have gotten stopped out myself and then this one was a really nice trade that, you know, you would have gotten hopefully around 10 points, at least for it.
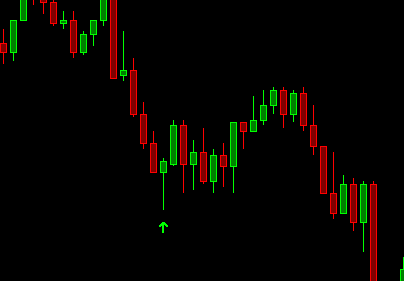
And then this one in this case, say the candle close right here. Again, it’s at the bottom of the candle. I wouldn’t want to enter right here. So I’d like to wait to see what this candle does, and maybe even wait until the next candle to see if the low keeps on getting cleared to then enter the trade. And, and, you know, maybe you would have taken some profits up here, but.
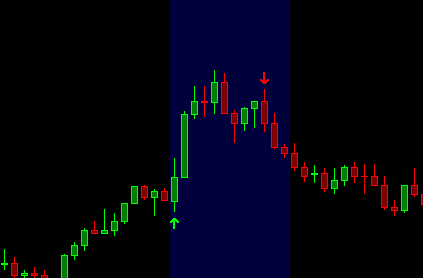
Likely I would have just let the trade run in the hopes that we would go towards these highs and then likely would have just gotten stopped out down here somewhere. So that’s really how I would trade it. Now, let me load up a 20,000 trade chart so that you can see how the alerts plot a little bit different.
So one of the things that you’ll see is that there’s just less alerts, right? Blue backgrounds are the overnight sessions and then the black background is the regular trading session. Alright, so now you can see that there’s very few alerts and this was the area that we were looking at previously. So you actually can see the same tool alerts this short, and then this long right here that we were talking about, the one over here is no longer showing up.
And then you have others that just simply don’t work out. Like these two, this one could have worked out. Maybe I think again, it’s hard to know which way we went first, but likely we wouldn’t lower and you would have gotten stopped out. So I actually liked this higher timeframe because it gives me an idea and better perspective as to where the market’s potentially going.
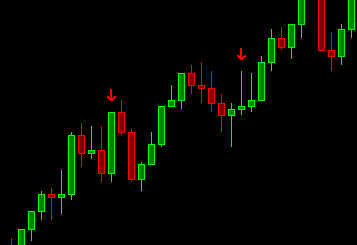
And then I can make a better decision if I actually want to enter into the trade or not. Let’s see, there’s other good trades right through here. And then there’s others that, you know, you got these two long trades that could have worked out, but you know, likely you would have shorted instead after it.
So you would have taken a little bit of profits, but there were still buyers in the market. So then the market just kept going up and up and up. So I’ll leave it at that. I hope that you were able to learn something from this study. And I would just watch it at first for a while so that you can get an idea as to how these alerts end up painting with the delay that is in one of the inputs.
Let me know if you have any questions and until next time everyone, happy trading!