Below is the transcript of the video you’ll get access to with your subscription.
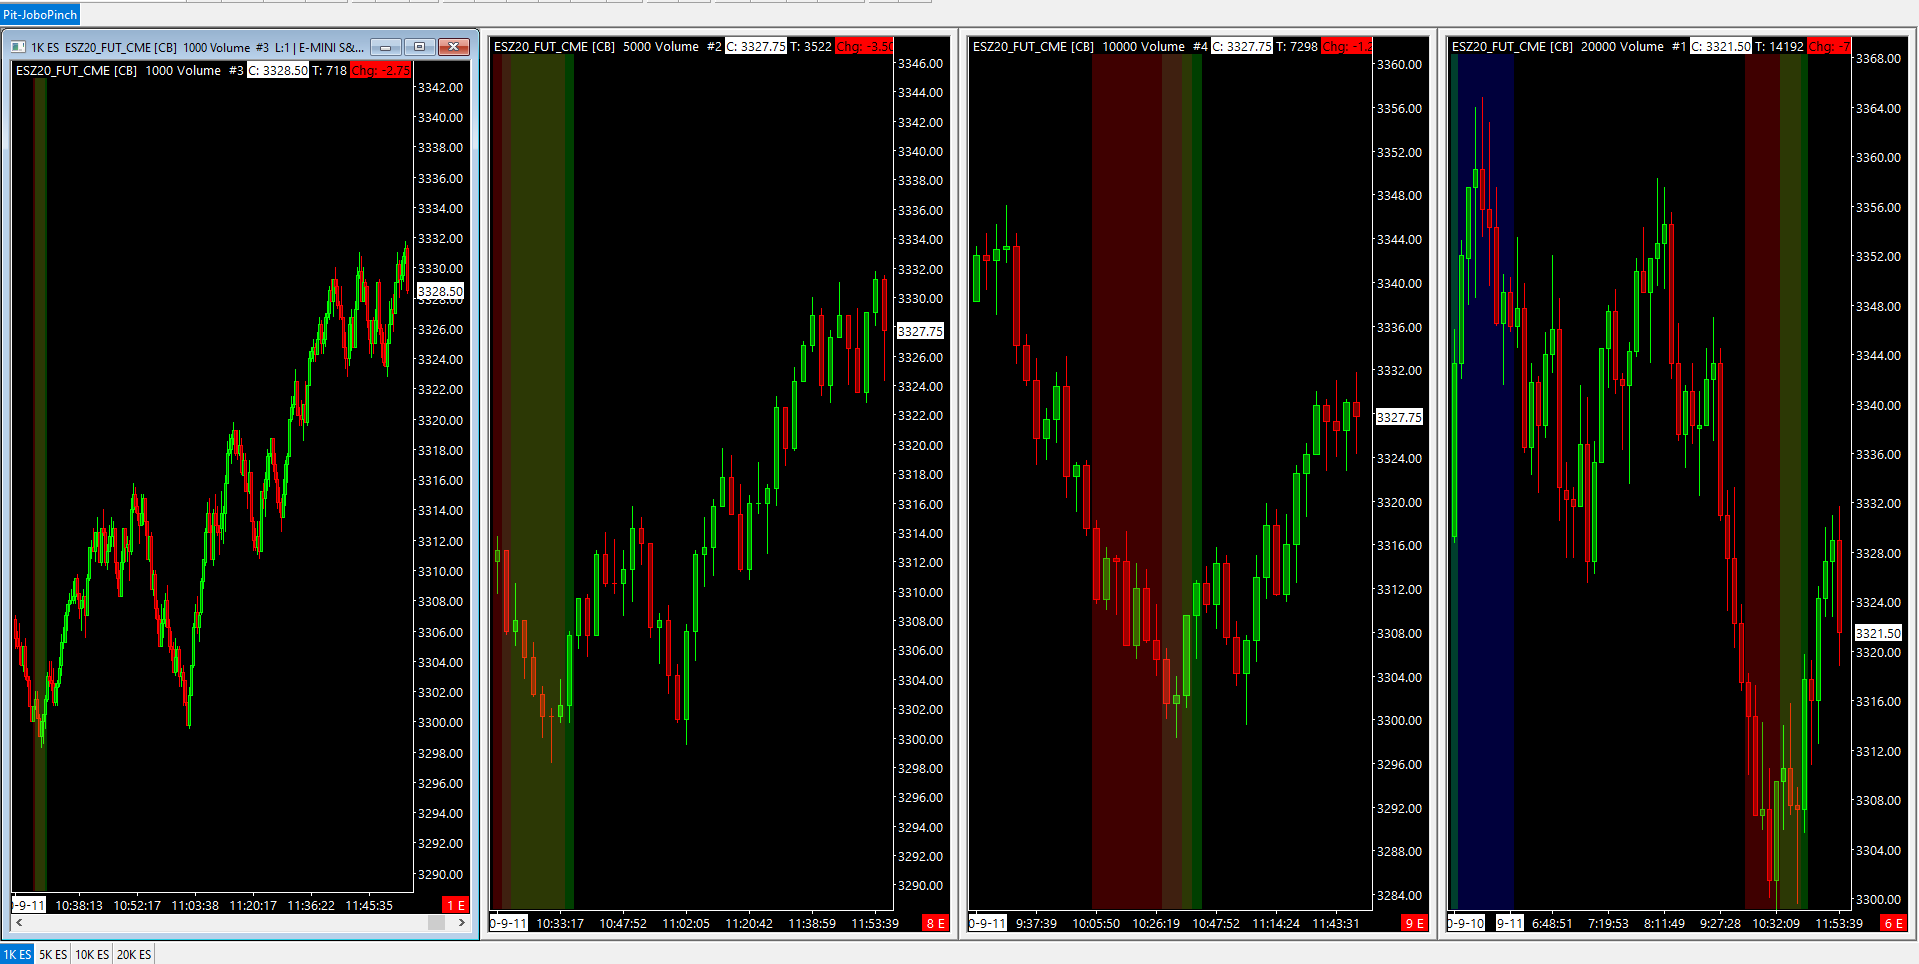
Hello folks, this is Ralph. And today I’m going to show you how to use the famous Jobo Pinch, if you haven’t already done. So please go ahead and watch the set of videos so that you can get set up with the same chart that you’re looking at right now in your Sierra Chart, Chart book. Alright, so we have a 5,000 trade chart with the Jobo Pinch on our left and a 20,000 trade chart over on our right.
And the 5,000 trade chart is only painting is only looking for Jobo Pinches. Whenever the pinch is also open or pinching on the 20,000 trade chart. What we’re going to do is we’re going to add two more charts here, and if we go to chart, duplicate chart and we’ll do this twice, and then we just want to organize them.
So we’re going to rename this very first one. And we’re going to change this to be just a 1000 trade chart.
You can either do 1000 or 2000. It’ll just be a little bit different. And then this other chart that we added, we will want to change to be 10,000. All right. So 10,000 trades. And then finally, what we want to do is we want to chain these together, but first let me just organize them a little bit. We’ll tell them vertically and.
So we want the 10,000 trade chart to link to the 20,000 trade chart, the 5,000 to the 10,000 and then the 1000 to the 5,000. Okay. So just going to go through that exercise real quick. Yeah. So this one’s already pointing correctly.
You can see it’ll change just so slightly.
Alright, I think now they’re all set up correctly. The way you want to trade this is you want to wait for one of the higher timeframes to begin pinching. And of course you can trade the will pinch by itself without having the different higher timeframes. In fact, I often use the 5,000 trade chart. By itself.
But I’ll often have an idea of where the 1000 and the 20,000 are. What I’m doing through this video is giving you really good high probability setups so that you can be successful with this study. As you get more comfortable, you can change it around. To fit your trading style more because obviously the higher timeframe, this 20,000 chart is going to be painting a lot less because you just simply need more time.
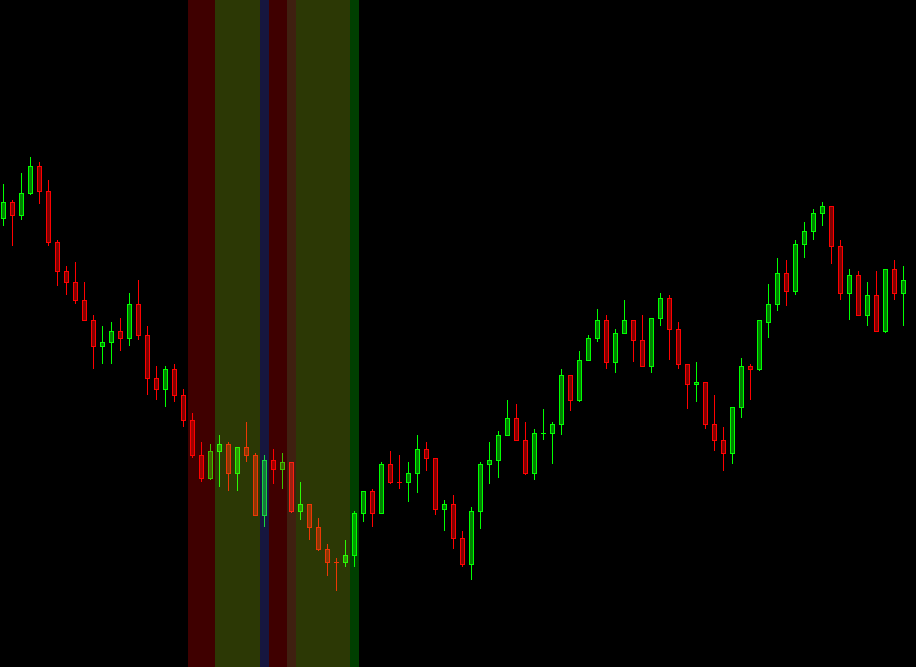
Whereas the 1000 trade chart, you’ll get pinches that paint through this little area right here, and then they release and you can catch a long trade through this area, but. Because they’re all linked together. It’s not painting right through here. Okay. So what I like to do is, again, we are going to look at one of these two larger timeframes, and then we’re going to take trades based on when these are optimally pinching or, you know, whenever there’s a good setup.
So let’s go ahead and look, let’s forget the 20,000 trade chart for a second. And let’s just look at the 10,000 trade charts. So let’s scroll left a little bit. And essentially what you’ll see here as the day is trading. You’ll see, this is pinching and obviously this one worked out. So maybe let’s go a little bit further back to this one that has the blue backgrounds, which means that it didn’t work out, but it did release on the 10,000 trade chart right here.
Right? So then you have your 5,000 trade chart, which is that, which has these few pinches that end up releasing. But these are actually a little bit further back. So let’s look at this area, right? So now we have 10,000 trade chart is pinching 5,000 trade chart is pinching in. Now you’re looking at the shortest of all timeframes, the 1000 tree chart.
And because of the way that they’re chained, sometimes you’ll get a pension and release right away on the shortest timeframe, just because of the chaining, but what you’ll want to do here is you’re waiting for the shortest timeframe to both pinch and release. Sometimes the pinch will be a little longer.
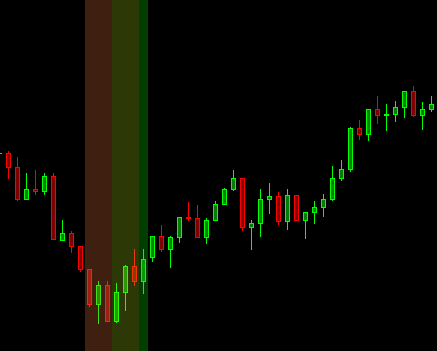
It really doesn’t matter. I hope you get the point here, but the idea is that it releases in this green candle right here. And now, if you’re looking at the other timeframes, the other two, the 5,000 and the 10,000 trade chart, you can see that we’re getting in towards the very bottom, right? So it was zoom in here a little bit.
And you’re getting in. So you get the, at the very top of this candle is when you buy your risk reward is excellent. Even with this trade that doesn’t end up working out on the highest timeframe. Again, we’re forgetting about the 20,000 trade chart. We’re just looking at the 10,000 trade chart. If you go along in this candle for the 10,000, you’re going to lose money.
But instead, if you’re getting long on the shortest timeframe, now you have a trade that actually works out. So, what you want to do is you get long here. You forget about the shortest timeframe. You just forget about it. Now you want to start looking at these higher timeframes because what’s going to happen, psychologically for you is you’re going to see the shorter timeframe you know, it goes up and then goes down and then you’re going to want to get out. And that’s why I say you need to flip and look at a different time frame. That is higher. So now let’s just minimize this and imagine we got long at this very bottom, right? Somewhere around here. So, I mean, there’s no reason to get out.
None of these candles gave you a really good reason. Yeah. We just went flat for a little bit and then went up. That gives you the opportunity to take profits or to move your stop up. As we’re moving up through this area. And then unfortunately, you know, price traded down at some point in time, which means that you got stopped out.
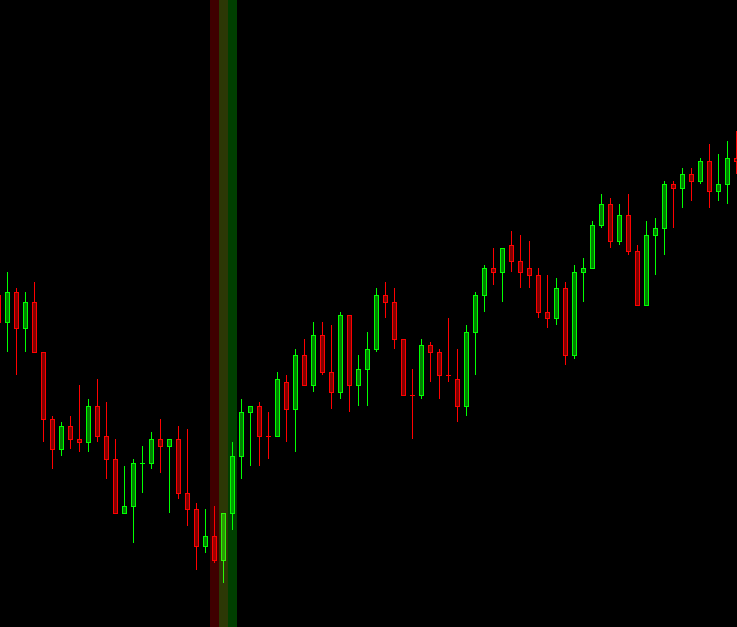
Hopefully you made money on this trade. If not, you just ended up exiting it for scratch. And now you bring up again the chart. So now we’re pinching again on the higher timeframe. You’re waiting for the shorter timeframe to start painting. So now I’ll actually just scroll over with this one. You’re waiting, waiting, waiting, waiting, waiting.
And then the pinch releases right here. Again. We’re getting in at the very, very bottom. Right? So your stop here is really just four or five points. And then if we, and then again, you get long, minimize it, forget about it. And now you’re looking at these two. So again, there’s no reason to get out, so we didn’t take out the low.
Now you get a release on both the 5k and the 20K and sorry, in the 10K.
and the rest is history. And depending on other factors, you may want to get out at some point in time, take profits to half-profits, whatever it is for your trading strategy. The point of this video is to show you when to get in at the best time. Okay. So now that you know that you can incorporate this with an even higher timeframe, which is going to be the 20,000 trade chart.
So because the 20,000 tree chart doesn’t happen all the time. Of course, I picked an area where we sold off and it actually pinched. But if you actually look at this and zoom out, I don’t have that many days loaded and we’ve been selling off for a while. So let me just quickly load 60 days here.
So now, if I scroll over to the left, you’ll see that, you know, there’s weeks, sometimes where the pinch does not release for this 20,000 trade chart. And sometimes you’ll just get one a day. So this is, would be a single trade a day. And I mean, sometimes the trade just doesn’t work out. Right. But the point here is that you have the ability now to use the 10,000 trade chart without the 20,000 trade chart, because the 10,000 will just occur more often.
Now if you, if you are looking at the 20,000 trade chart, you can apply the exact same strategy, right? So you looking at the higher timeframe, it is pinching. You’re waiting for the smaller timeframes to release, let’s see on this 1000 tree chart was way over here. Same thing with the five. Um, and the 10. So if we scroll to the left, you’re getting in way, way, way down here.
And potentially, you know, you tried it again over here, went up, might’ve gotten in for scratch, lost money. That is okay. You know, over time this strategy will make you consistent money. And that’s why everybody loves this strategy. So I think now that we’re using four different timeframes, when you get into a trade.
Stop looking at this one and stop looking at potentially this one in now, you’re only focused on two higher timeframes because that is essentially the timeframe that you were targeting for your trade okay? So now we’re, we’ll scroll over to the rights that one releases are watching to see of the 20,000 trade chart releases.
And there we go. And the 20,000 trade trade is just such a good pinch release. It always has such a larger move. And of course you need to know that there’s going to be swings back and forth, but you got to hold onto that trade. You could even play options if you wanted. So, that’s actually the end of.
The data that I have because you know, right now it’s the weekends. All right. So I hope that actually gives you a really good idea of how to trade the Jobo Pinch consistently. One other thing that I like to look at, and this is just way beyond this video, but you can look at the Order Flow, so you can use the Reconstructed Tape study to see how the Order Flow is at these lows.
And you will see buyers stepping in and that’s, what’s going to give you the confidence. To enter into the shortest timeframe. Right? So sometimes, you know, we’ll see the release on the shortest timeframe over here. But there are no buyers stepping in, price is, just sort of floating up. And the pinch releases that to me does not give me any confidence to get into the trade.
So I just won’t touch it. I’ll skip it. And it doesn’t always work out. Right. Like sometimes buyers do step in, but then more sellers step in afterwards, after we go up a little bit, they’ll sell the tops, but that’s just training. Right? So what I’m teaching you here is. You need to stack up different conditions, right?
So you have a little stack of conditions. Right now we have a stack of four conditions, but if you also had the Reconstructed Tape on your screen, that adds to your stack of conditions that need to be made that before you enter into the trade. And that’s honestly, what’s going to keep you from losing.
Almost any money, right? That’s, what’s going to keep you trading consistently and profitably over and over again. So I hope that you found this video useful and can incorporate the Jobo Pinch as one of your trading strategies. And once again, just a shout out to Jobo for sharing this trading strategy with us.
And until next time everyone, happy trading!