Below is the transcript of the video you’ll get access to with your subscription.
Hello folks, this is Ralph. And today I’m going to share how to use the price TICK divergence study in Sierra Chart, if you haven’t already done. So please go ahead and watch the set up video as we’re picking up, right where we left off. What I’m going to do today is I’m going to replay the data for this day, at the very beginning of the day, because there was a good amount of divergences that plotted.
So we’re actually going to trade those. And that’s why I have the trade wind to open here. So I’ll be clicking the buy and sell at market buttons and you’ll see how I would TICK the trades. I’ll speed up the replay so that we’re not going exactly at real time. So I’m going to have to be a little bit fast and the trigger here, so we’ll see how it goes.
So let’s go ahead and start the replay. Now I’m actually just going to start it at the beginning of this alert here. So let’s see it’s rounds. It’s 45 in the morning. Again, I’m Pacific time. So market opens for me at six 30 in the morning. Let’s go ahead and start it at 15x. We may slow it down or speed up depending on how fast or slow it is.
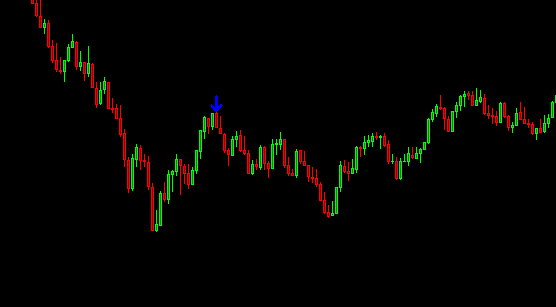
All right. So here we go. We’re seeing the first alert and you know, we’re looking at it and evaluating if we want to take the trade, ideally I’d like price to come a little bit lower, but let’s just aggressively take this trade and we’ll buy the market right here. I’m monitoring now to see if we’re clearing the highs potentially to see if the trade is working out or we start cleaning the lows like we did just now, I just want to exit the trade as fast as possible, last three and a half points on that one.
And I would say it was a little too slow on that one. So, okay. We’re starting to see another alert sort of show up. It’s try to show up there for a second. So now you need to be on your toes. Potentially more alerts will show up, but since that one didn’t stick, I don’t want to buy the market again.
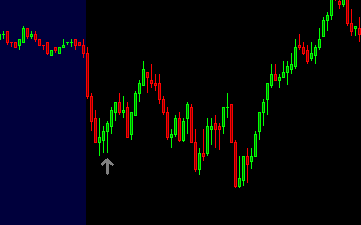
Okay. Now we’re getting a sell. They really want to see these start sticking. So K, now we have two back to back. Now we want to see if we clear the lows here, but now we’re starting to get other alerts. So let’s close that out because we got alerts in the other direction. Now we’ve got a second one, so I want to buy it.
And I’m going to go in with two contracts because I feel good about this one.
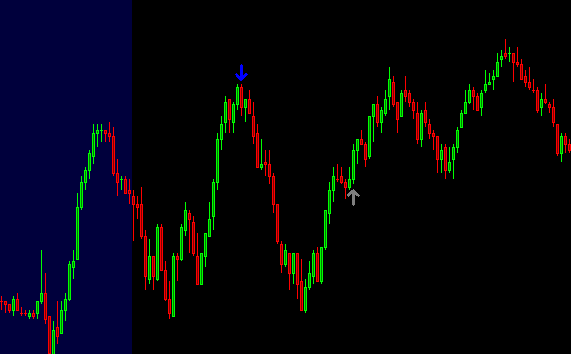
Now again, a monitoring to see if we clear these lows, or if we break that this last swing high. Obviously sellers seem to be having a hard time. We’re getting another plot to go long. Now we’re starting to get to the previous swing high, which usually is a good spot for me to take profits for at least half of my, my trade.
Let’s wait to see if we can get back up there and now we’re getting other plots on the other side. So I’m going to exit half here and now we’ve cleared that high, which is great. Let’s see how far. Okay. So now we’re getting blue alerts. I’m going to just exit this trade. Now. It’s, now we’re getting back to back alerts.
I want to sell the market here and it’s close to this high. So it’s actually a good risk reward. It’s not working out and I’m flat low to slow. Plus I miss miss that button, but now we’re getting another alert. Right? So that’s interesting. It didn’t actually hold so we won’t sell again. We’ll just wait to see what happens.
Okay. So now we’ve got another one here. I’m just going to go in with one contract. I’m not sure if it’s going to work out here, but I don’t want to see price trade above the highs here.
Okay. We’re still on our toes here and now it’s going in our direction. So let’s see what continues to happen. We’re monitoring. Now we had this low down here and this high right here, where there was some resistance, not sure if it’s gonna work out, but can, now we’re starting to see some plots. They’re trying to plot it.
So now I’m going to flatten here. We’ll see another one. And now I’m going to go long again because we got back to back divergences, but I don’t want to surprise to keep moving down a little bit more and I’ll be out okay. That worked. That’s looking good.
I’d like to clear the high, so monitoring for that, but a break of this low. And I would be out,
I wish over to Gannon with two contracts because I could have taken some profits right up here. No, I got my, my hand, my, my pointer on the flatten button, because if it clears that low, I want to be out as fast as possible.
It seems like buyers are having a difficult time here and we broke the low. So now I’m out. And I think that really was the last alert. There may be others. I get plotted. That weren’t plotted before, but essentially that’s what I wanted to show you, you know, that quick in and out. And obviously I messed up a few of the trades, but in all, in all, I got five points out of this quick little training session, just based on this one indicator.
And I think that’s pretty cool, right. Had I traded better? Had I trade more size? You know, obviously things could have been different, but as long as you have a quick risk reward and your observance of what has happened before in the market, I think it really gives you a good opportunity to continuously make money using this study.
So I hope that you found this helpful and until next time everyone, happy trading!