Order flow trading is an essential approach for traders who want to understand the real-time dynamics of buying and selling in financial markets. By focusing on the flow of orders, traders can uncover market sentiment, detect turning points, and make more precise decisions. Unlike traditional indicators, order flow tools dive deep into market activity, offering unparalleled transparency into price movements.
This blog post introduces some of the best order flow indicators that traders can use to enhance their strategies. We will explore key tools such as footprint charts, VWAP, volume delta, depth of market (DOM), time and sales, volume profile, and market profile, explaining how each indicator works and how it can be applied to your trading toolkit.
What Are Order Flow Indicators?
Order flow indicators analyze the interactions between buy and sell orders in the market. They provide insights into the forces driving price movements, including supply and demand imbalances. Unlike technical indicators that rely on past data, order flow tools show live market activity, helping traders anticipate trends and reversals with greater precision.
Key components of order flow trading include:
- Executed Orders: Trades that have already occurred.
- Pending Orders: Buy and sell orders waiting in the market (visible through tools like DOM).
- Supply and Demand Imbalances: Areas where buying and selling pressures differ significantly.
By incorporating order flow indicators into your strategy, you can identify critical levels, confirm trends, and spot market reversals.
The Best Order Flow Indicators
1. Footprint Charts
Footprint charts offer a granular view of trading activity by displaying executed buy and sell orders at each price level. Think of it as the market’s diary—it tells you exactly where buyers and sellers had their most dramatic moments. I personally like the footprint chart as it provides a very granular view into executed orders, but I personally don’t use it as much in my trading, mainly because it can also be overwhelming.
Types of Footprint Charts:
- Bid/Ask Footprint: Shows the number of orders executed at bid and ask prices.
- Delta Footprint: Displays the net difference between buy and sell orders at each price level.
- Volume Footprint: Breaks down volume by price and time, revealing market turning points.
How to Use Footprint Charts:
- Identify areas of strong buying or selling activity.
- Confirm market sentiment through net buying or selling pressure.
- Pinpoint support and resistance levels based on high-activity zones.
Footprint charts are especially useful for traders looking to confirm trends or spot imbalances in real-time.
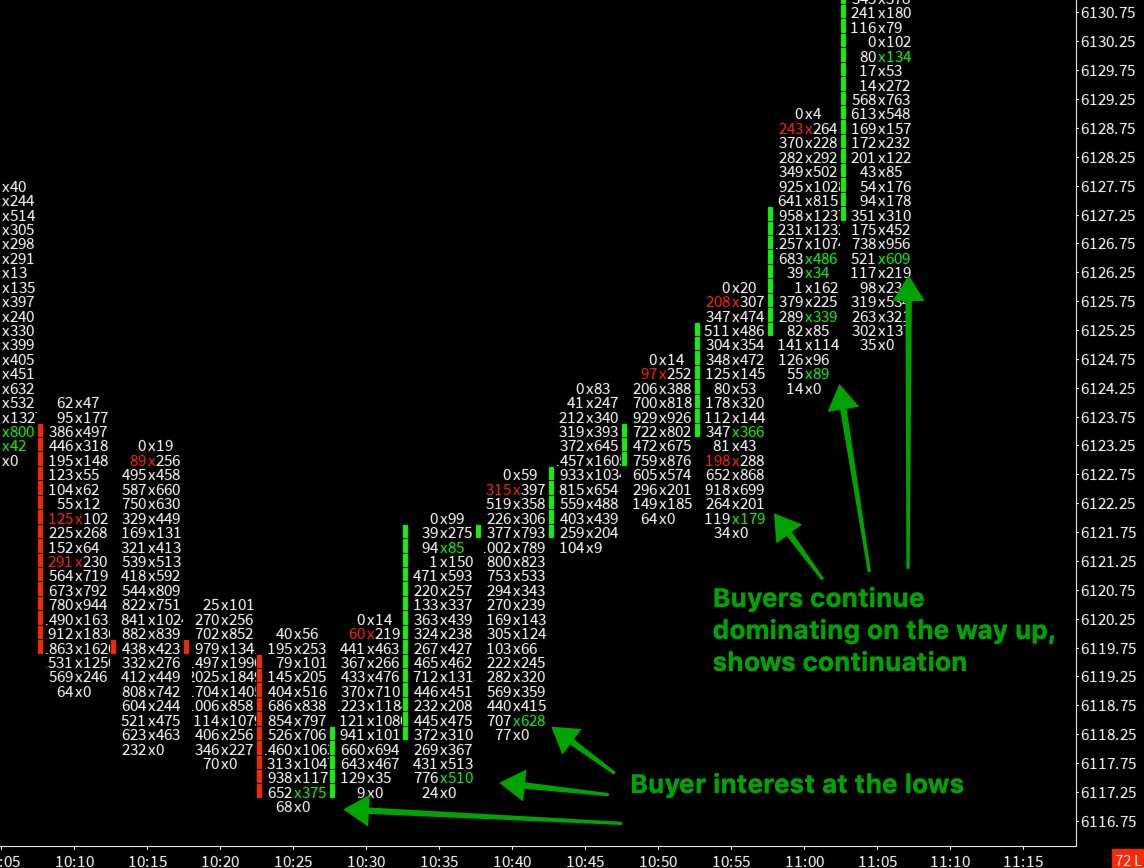
Here’s an example of how a footprint chart can provide confirmation that buyers are aggressively pushing price higher.
2. Volume Delta
Volume delta measures the difference between buying and selling activity in a market. It quantifies net buying or selling pressure for each price bar, offering insights into market momentum and potential reversals. It’s like listening to a heated argument between buyers and sellers—whoever’s louder (or has more volume) usually wins, but not always in the way you’d expect!
Key Delta Values:
- Positive Delta: Indicates buying pressure exceeds selling pressure.
- Negative Delta: Indicates selling pressure dominates buying pressure.
- Near Zero Delta: Suggests equilibrium between buyers and sellers.
Applications of Volume Delta:
- Spotting Reversals: If the price rises but delta turns negative, it could indicate weakening buying momentum.
- Confirming Trends: A strong positive delta during an uptrend signals robust buyer activity, while a negative delta in a downtrend confirms seller dominance.
Volume delta is a versatile tool for tracking market sentiment and assessing the strength of price movements.
Example:
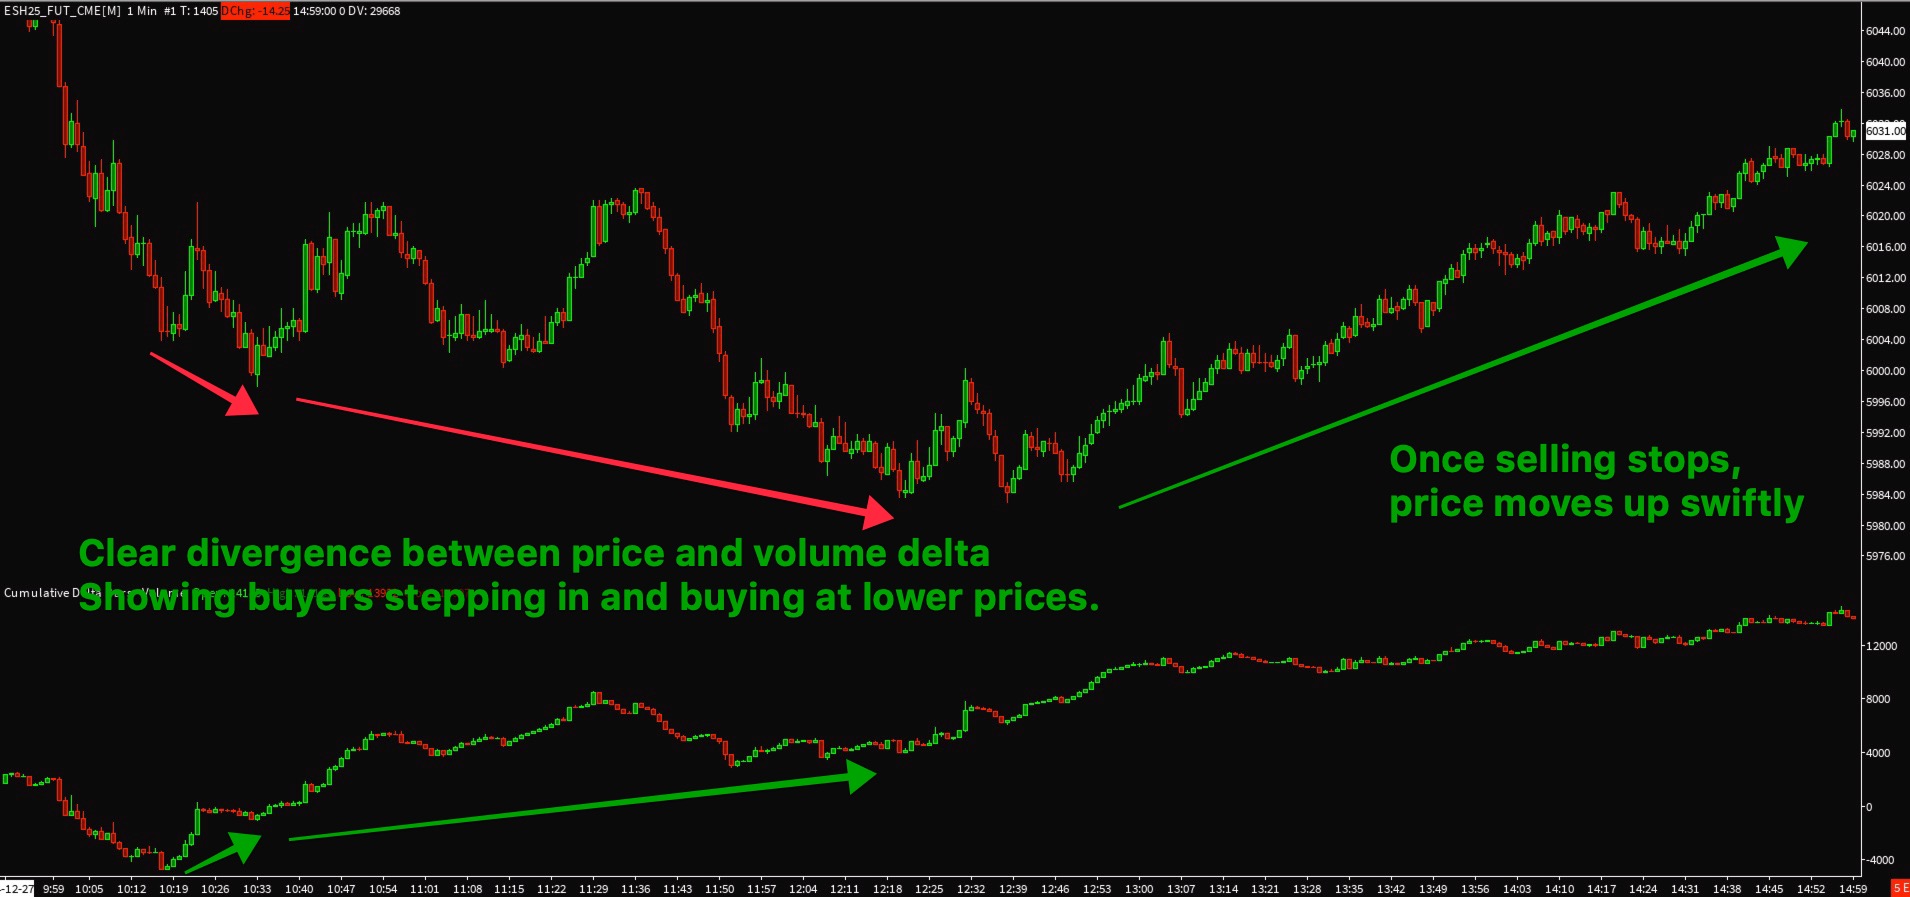
You can see a divergence between price and volume delta. You can see that the divergence is not immediately resolved, but rather it takes time. As a trader it’s important to be patient and take note, use other tools to help you get the best entry.
 3. VWAP (Volume-Weighted Average Price)
VWAP is a benchmark indicator used by institutional traders to assess whether an asset is trading at a premium or discount. It calculates the average price of an asset, weighted by its trading volume, over a specific period.
Why Use VWAP?
- Institutional traders often aim to buy below VWAP and sell above it.
- It acts as a dynamic support and resistance level for price movements.
Applications of VWAP:
- Use VWAP to identify entry and exit points.
- Monitor price deviations from VWAP to spot potential reversals.
- Align trades with institutional activity for higher success rates.
To be frank, VWAP is not my favorite indicator. I have it on my charts just because I know other traders look at it, and sometimes price will react to it but it doesn’t always react to it in a meaningful way, I’ll go as far as to say that VWAP is overrated.
4. Depth of Market (DOM)
DOM, also known as the order book, displays the number of buy and sell orders at various price levels. It is a crucial tool for understanding market liquidity and potential price movements.
How to Use DOM:
- Detect support and resistance zones by identifying clusters of large orders.
- Monitor buy and sell imbalances to predict short-term price shifts.
- Scalpers can use DOM to identify quick trading opportunities based on liquidity.
DOM is especially valuable for traders looking to capitalize on short-term price movements and liquidity imbalances.
DOM Strategy:
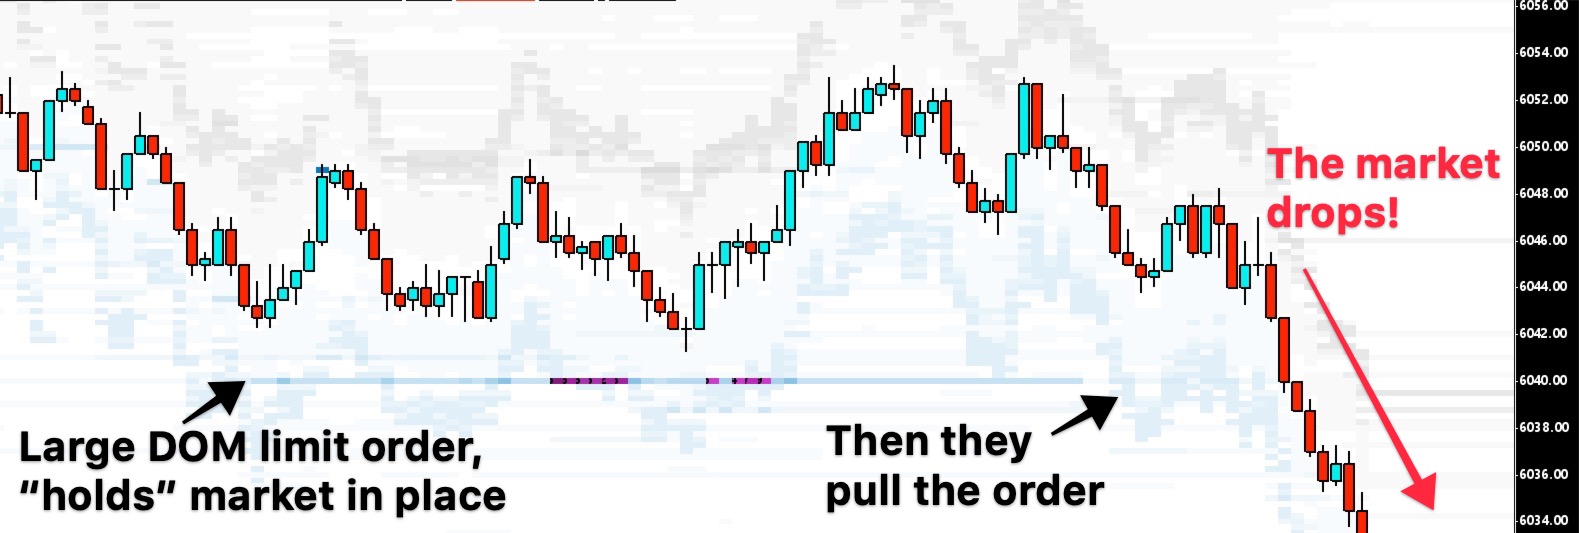
One signal that I like to see on the DOM is the “flashing” of high liquidity near the current price. If I see a large order suddenly appear on the DOM regardless of whether the market is trending up/down or sideways, I typically see that as someone letting other market participants know that they want the market to move in the direction of their limit order. Sometimes, they just want to “hold price” before the move occurs, causing a fakeout, see the image below as an example.
5. Time and Sales
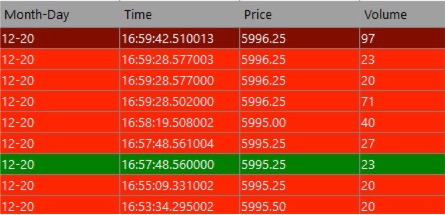
Time and sales (also known as the “tape”) provides a historical record of executed trades, detailing price, quantity, and time.
Key Insights:
- Monitor the speed and size of trades to detect momentum shifts.
- Spot large orders to gauge buyer or seller aggression.
Applications:
- Identify periods of strong buying or selling pressure.
- Confirm market trends by analyzing trade flow patterns.
6. Volume Profile
Volume profile is a graphical representation of trading activity at different price levels. It provides a horizontal histogram of volume, helping traders identify areas where significant trading activity has occurred.
Applications of Volume Profile:
- Value Areas: Identify price levels with the highest trading activity, which often act as support or resistance.
- Low Volume Nodes: Spot areas of low liquidity, which can signal breakout points.
- Trend Confirmation: Use volume distribution to validate price movements and anticipate reversals.
Volume profile is an essential tool for understanding market structure and aligning trades with areas of significant interest.
Example:
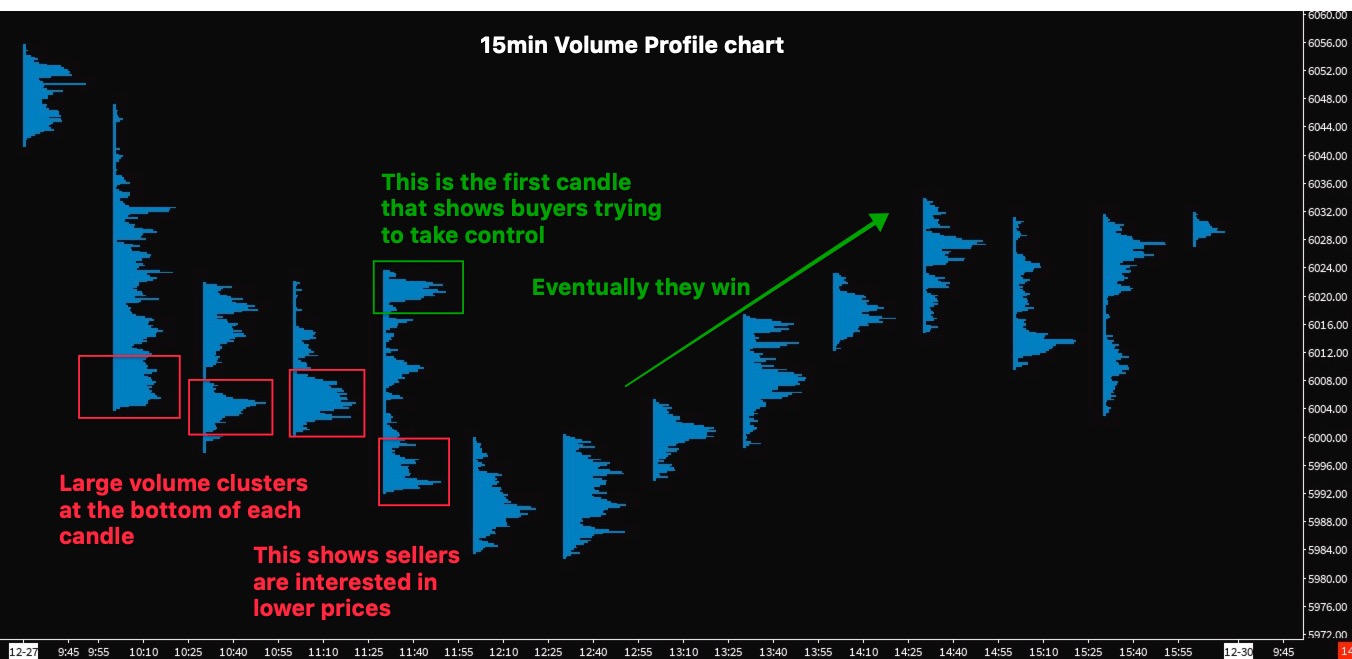
Here’s another example of how order flow can help you see the aggression of market participants. While you might’ve noticed the volume clusters early in the day and may have taken a short position, if you were able to notice the upper cluster at 11:40, that would’ve helped you stay nimble and get out of your short when the market started making higher highs.
 7. Market Profile
Market profile is a charting technique that organizes price and time data into a bell-shaped curve. While not strictly an order flow indicator, it provides valuable insights into market behavior and price discovery.
Key Features of Market Profile:
- Value Area: The price range where most trading occurred during a session.
- Point of Control (POC): The price level with the highest trading activity.
- TPOs (Time Price Opportunities): Segments of time spent at specific price levels.
Applications:
- Identify key support and resistance zones.
- Analyze market sentiment through price distribution.
While market profile doesn’t directly analyze executed orders, its insights into market structure make it a complementary tool to order flow trading. I plan to write a detailed post about market profile in the future, so stay tuned for an in-depth discussion.
Example:
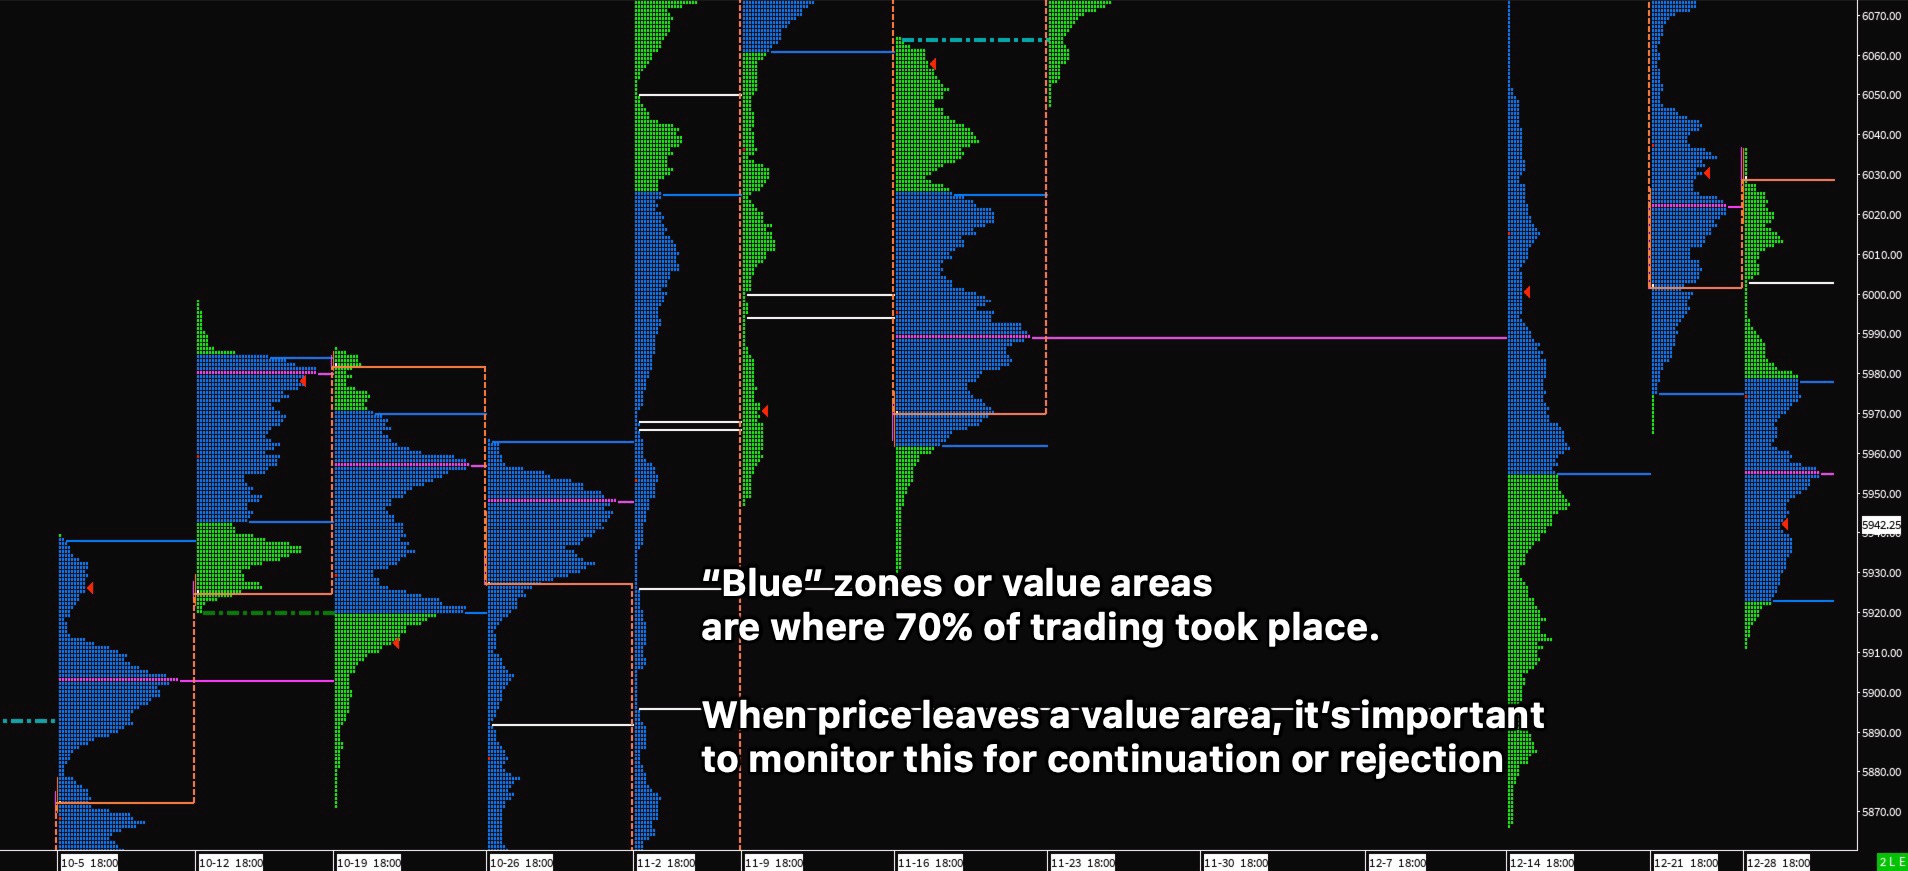
Here’s a simple image of what the Market profile looks like. Look out for a future post on how I use the market profile.
 Why Use Order Flow Indicators?
Order flow indicators offer a competitive edge by:
- Providing real-time insights into market dynamics.
- Identifying critical levels for support, resistance, and reversals.
- Offering transparency into buying and selling pressures.
While these tools require practice and a steep learning curve, their ability to reveal live market sentiment makes them indispensable for serious traders.
Getting Started with Order Flow Trading
To incorporate order flow indicators into your trading:
- Choose the Right Platform: Look for platforms that offer tools like footprint charts, DOM, and volume profile. We recommend Sierra Chart, for it’s extensive capabilities and excellent performance handling dozens of charts at a time.
- Learn the Basics: Familiarize yourself with key concepts like supply and demand dynamics and volume analysis.
- Practice with a Demo Account: Hone your skills in a risk-free environment. You can use a simulation account in Sierra Chart for this.
- Develop a Strategy: Define clear rules for entry and exit based on order flow data. The only way you’ll get better at this is by spending time in front of the screen.
- Stay Informed: Monitor market news and events that could influence order flow.
FAQs
1. What is the best order flow indicator for beginners?
VWAP and footprint charts are ideal for beginners due to their straightforward application and effectiveness in identifying key price levels.
2. Can I combine order flow indicators with other strategies?
Yes, order flow indicators work well with technical analysis and price action strategies to provide a well-rounded approach.
3. Is market profile an order flow indicator?
Not quite, but it complements order flow trading by offering insights into price distribution and market structure.
4. How do I interpret volume profile charts?
Focus on value areas for support and resistance, and watch for low-volume nodes as potential breakout points.
5. Can order flow trading be used in all markets?
Yes, it is applicable to Forex, stocks, futures, and even cryptocurrencies, provided there is sufficient market liquidity.
Order flow indicators like footprint charts, VWAP, volume delta, and volume profile empower traders to understand market behavior more deeply. By mastering these tools, you can gain a significant edge in your trading journey. Dedication, practice, and a thorough understanding of these indicators will help you unlock their full potential.
