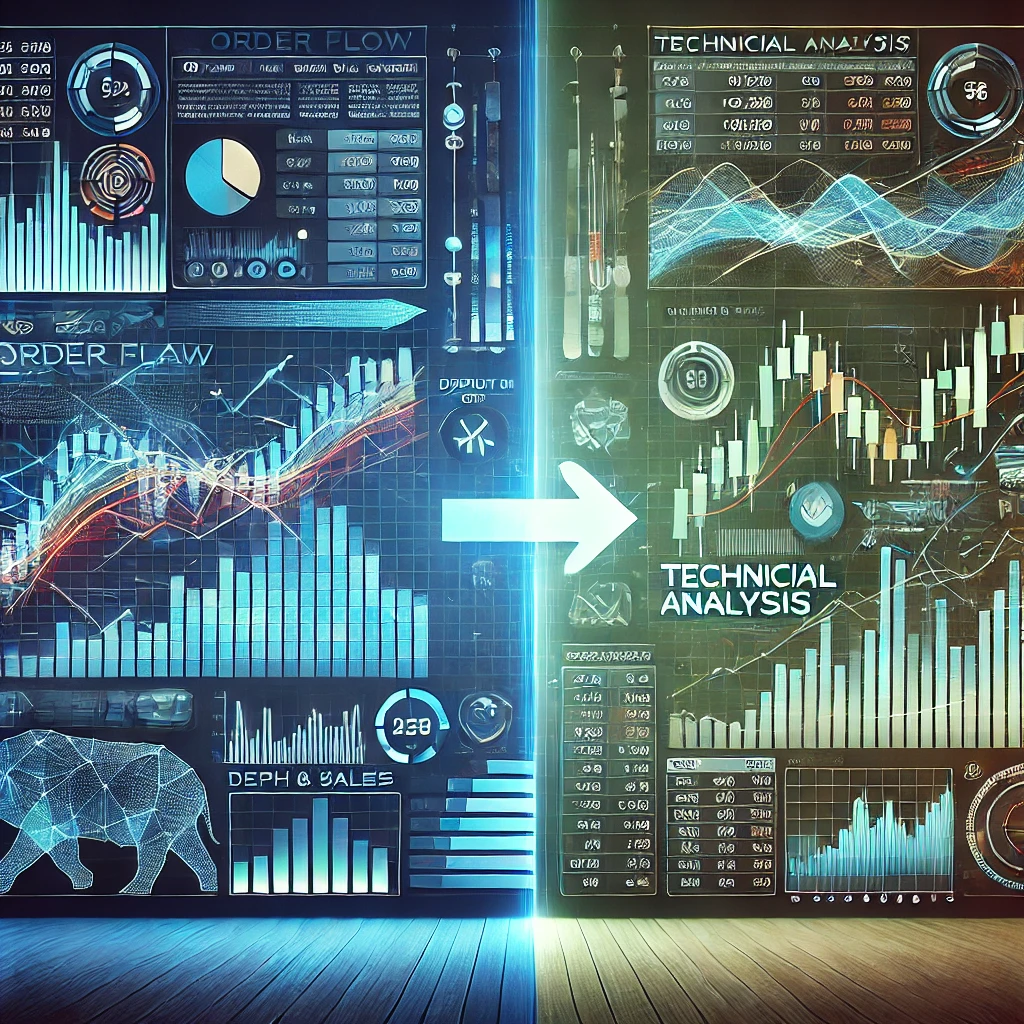
When it comes to trading, understanding the tools at your disposal can make a significant difference in your success. Two of the most popular methods traders use are Order Flow Trading and Technical Analysis. While both have their advantages and limitations, they serve different purposes and cater to different aspects of the market. This blog post will dive into the distinctions between these two methods, explore their strengths, and discuss how they can complement each other.
What Is Technical Analysis?
Technical Analysis (TA) is one of the most widely used methods in trading. It involves analyzing historical price data, chart patterns, and technical indicators to forecast future price movements. Traders employ tools like:
- Moving Averages: To determine overall trends.
- Relative Strength Index (RSI): To measure momentum and identify overbought or oversold conditions.
- Bollinger Bands: To assess volatility and potential breakouts.
- Stochastic Oscillator: To gauge momentum and trend strength.
TA simplifies the market into patterns and signals, making it easier for traders to make decisions. However, its reliance on past data introduces a significant limitation: indicators are inherently lagging.
The Lagging Nature of Technical Indicators
Technical indicators are derived from historical price data, such as open, high, low, and close (OHLC) prices, or past volume. For example:
- A Moving Average is calculated over a set period, smoothing out fluctuations but lagging behind real-time price changes.
- Breakouts signaled by indicators often occur after the price has already moved significantly, leaving traders with suboptimal entry points.
While TA provides structure and simplicity, it lacks the ability to reflect real-time market dynamics or the intentions of market participants.
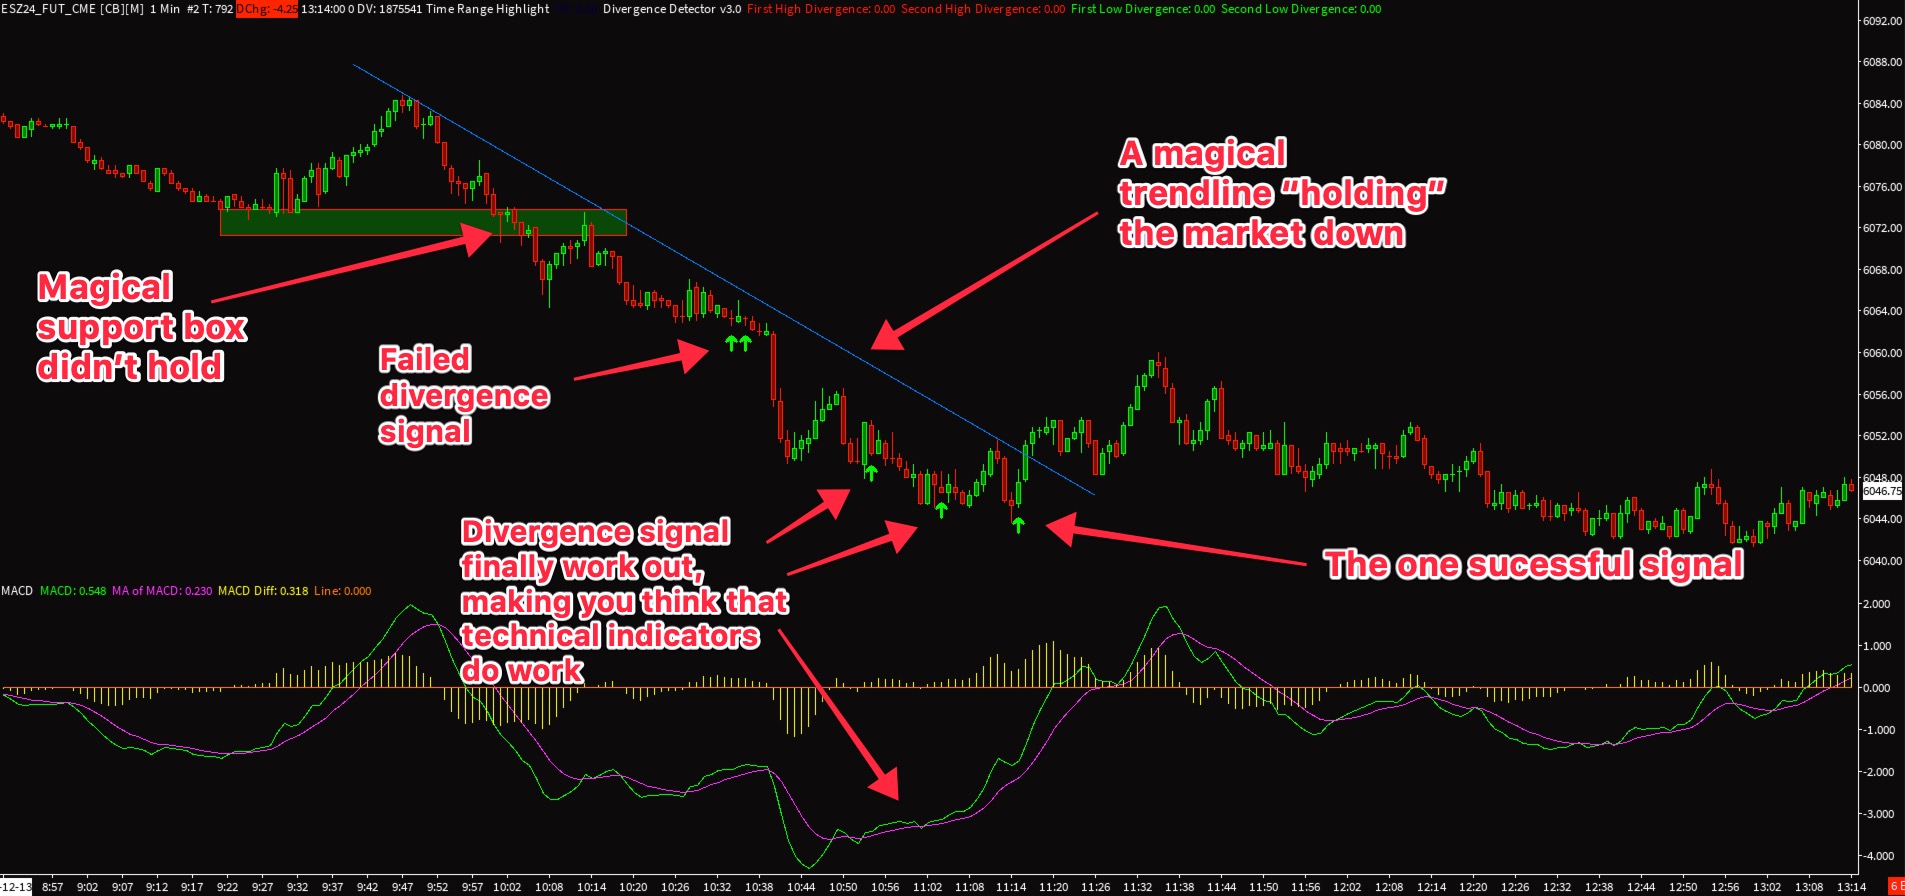
A typical technical analysis chart, with support drawn, a trend line and MACD with divergences plotted. You can see technical analysis sometimes works, but it’s often a coin toss.
What Is Order Flow Trading?
Order Flow Trading (OFT) focuses on analyzing real-time buying and selling activity in the market. By examining incoming orders, order book depth, and volume profiles, traders gain insights into supply and demand dynamics.
Key Components of Order Flow Trading
- Cumulative Delta: Tracks whether buyers or sellers dominate the market.
- Order Book Depth: Shows pending buy and sell orders at various price levels.
- Time and Sales Data: Displays individual trades as they occur.
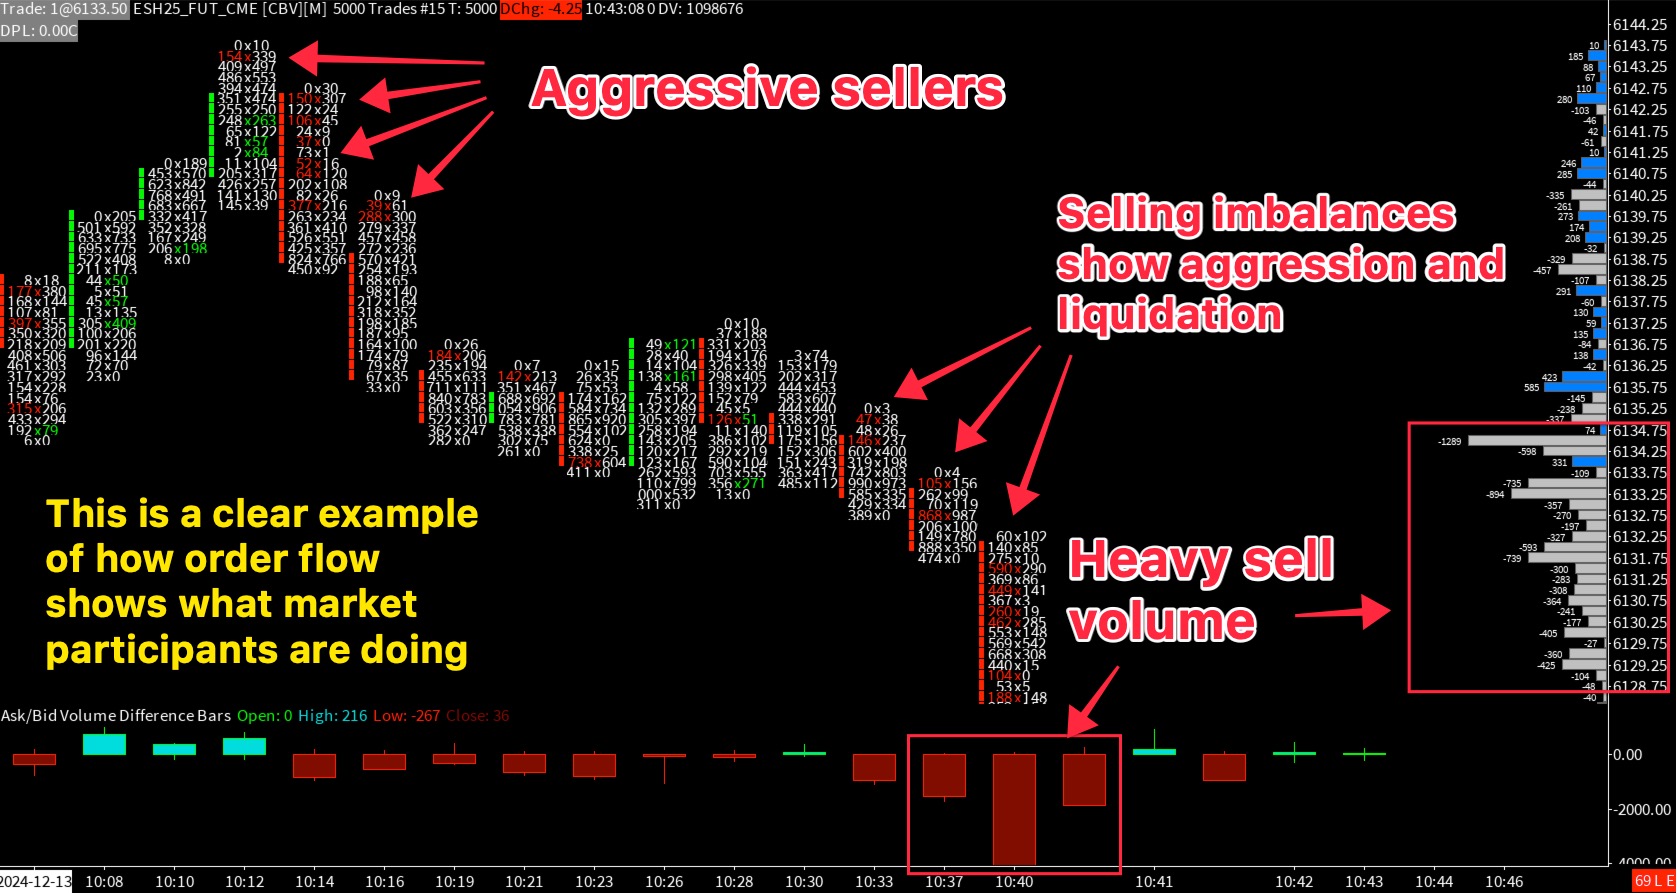
- Footprint Charts: Provide a detailed view of market activity at each price level.
Unlike Technical Analysis, OFT enables traders to observe how market participants interact in near-real-time. While not entirely predictive, it is as close as traders can get to seeing the market’s immediate intent.
Order Flow vs. Technical Analysis: The Key Differences
| Aspect | Order Flow Trading | Technical Analysis |
|---|---|---|
| Data Source | Real-time market activity (order book, trades). | Historical price data (candlesticks, volume). |
| Timeframe | Near-real-time insights. | Past and historical data. |
| Predictive Power | Shows how recent participants are behaving, providing clues about potential outcomes. | Uses formulas to project probabilities, often no better than guessing. |
| Purpose | Understand supply/demand and sentiment. | Identify patterns and mathematical signals. |
The Lagging Nature of Both Methods
It’s important to note that both Order Flow and Technical Analysis are lagging to some degree:
- Order Flow reflects events that have just happened but shows them in near-real-time, making it the closest tool to seeing current market sentiment.
- Technical Indicators calculate signals from past data, often providing delayed insights that can lead to missed opportunities.
Order Flow doesn’t predict the future, but it provides a much clearer picture of how market participants are engaging with the market at the moment. This clarity can help traders anticipate potential outcomes, especially when combined with a solid trading thesis.
How Order Flow Can Complement Technical Analysis
Combining Order Flow with Technical Analysis allows traders to overcome the limitations of each method and improve their decision-making process. Here’s how:
- Confirming Signals with Order Flow
Technical indicators often produce signals that can be ambiguous or misleading. By observing Order Flow, traders can validate these signals in real-time. For example:- When a Moving Average suggests a breakout, Order Flow can confirm whether buying pressure supports the move or if it’s likely a false breakout.
- Analyzing Volume for Market Sentiment
Volume is a critical component of both methods:- TA uses volume to validate price movements.
- OFT dives deeper by showing whether trades are driven by aggressive buyers or sellers, providing additional context.
- Identifying Liquidity Levels for Better Entries and Exits
- TA identifies support and resistance levels based on historical price action.
- OFT enhances this by showing real-time liquidity levels, revealing where market participants are placing significant buy or sell orders.
- Market Profile for Context
Tools like Market Profile, used in OFT, provide a visual representation of market activity. This can add depth to TA by highlighting areas of high and low participation, which often align with support and resistance zones.
Practical Example: Validating a Sell Signal with Order Flow
Imagine a trader sees a sell signal on the MACD (Moving Average Convergence Divergence) indicator. Based solely on TA, the trader might short the market. However, by incorporating OFT, the trader could look for additional clues:
- If the breakout is valid: Order Flow would show a consistent increase in selling pressure, with bids moving off the market and an accelerating negative delta.
- If the breakout is false: Order Flow would reveal strong bids absorbing selling pressure, with negative delta tapering off and volume decreasing.
In this scenario, Order Flow provides the context needed to either confirm or negate the trade idea, reducing the likelihood of errors.
Conclusion
Both Order Flow Trading and Technical Analysis offer valuable insights into the market, but they serve different purposes. Technical Analysis simplifies market behavior into patterns and indicators, while Order Flow provides near-real-time insights into market sentiment and dynamics.
By understanding their differences and combining their strengths, traders can create a more robust strategy. Whether you’re a seasoned trader or just starting, integrating these methods can help you make better-informed decisions.
FAQ
1. Is Order Flow Trading better than Technical Analysis?
Not necessarily. Order Flow Trading and Technical Analysis serve different purposes. OFT provides near-real-time insights, while TA simplifies historical data into patterns. The best approach often involves combining both methods.
2. Can Order Flow predict the future?
Order Flow cannot predict the future with certainty. However, it shows how recent market participants are behaving, which can provide clues about potential outcomes.
3. Why are technical indicators considered lagging?
Technical indicators rely on historical price data and mathematical calculations, so their signals are inherently delayed compared to real-time market activity.
4. What tools are used in Order Flow Trading?
Common tools include Cumulative Delta, Depth of Market (DOM), Footprint Charts, and Market Profile.
5. Can I use Order Flow Trading and Technical Analysis together?
Yes, combining these methods can enhance your trading strategy by providing both historical context and real-time market insights.
At Sierra Trading we have a combination of studies that rely on both Order Flow and traditional Technical Analysis. We encourage you to checkout our studies for free so that you can see the edge they can give you in the market.
