In this video I review the tape after the FOMC Minutes for Wednesday August 19th, 2020.
You can watch the video or read the transcript below.
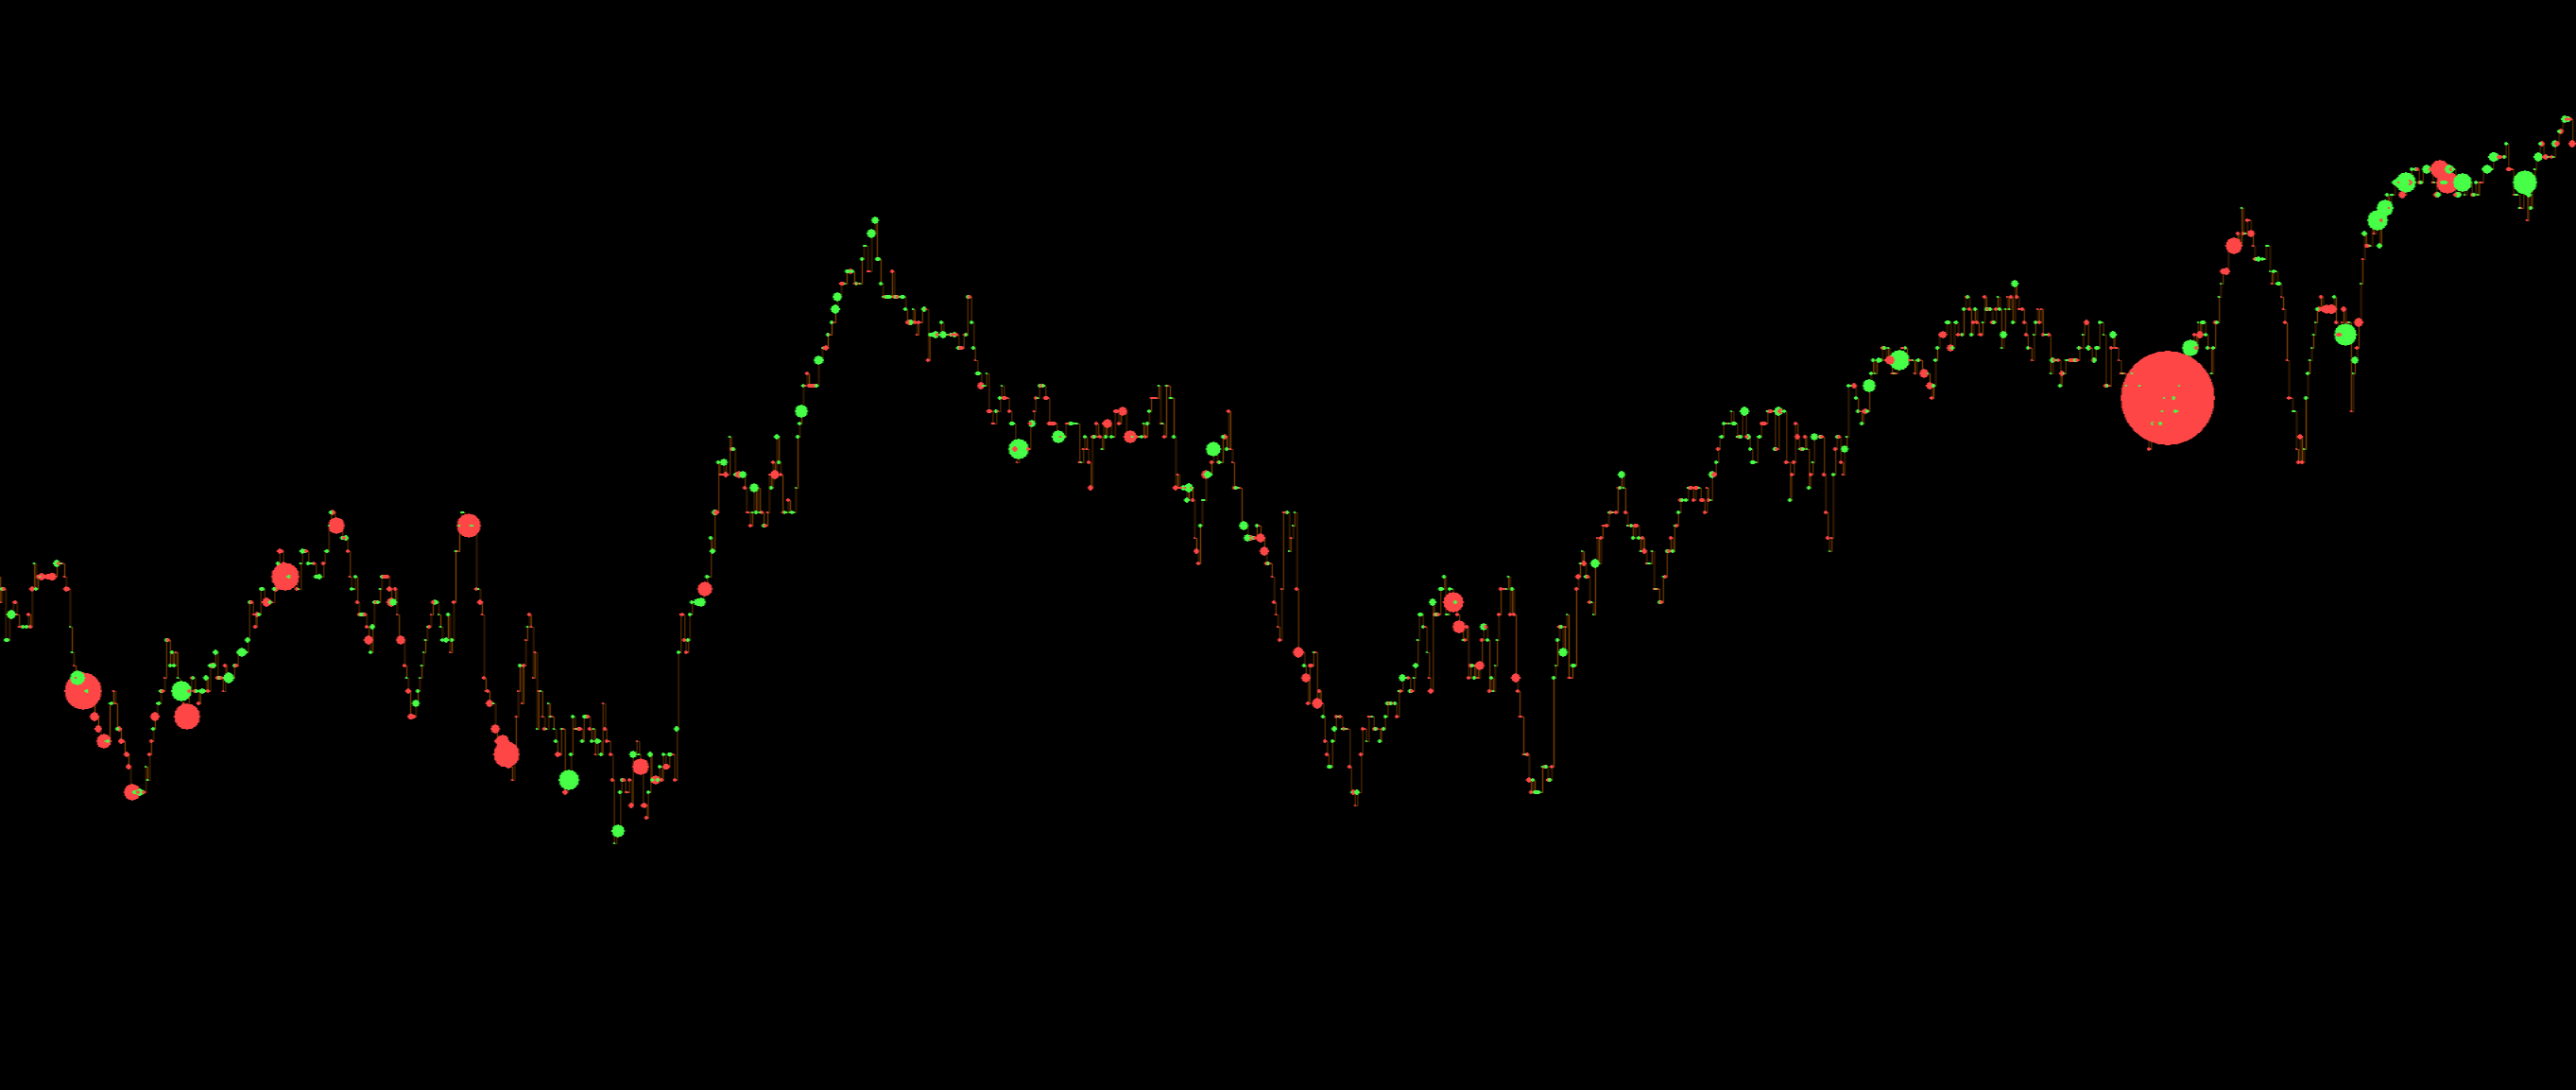
Hello folks, this is Ralph. And today I’m going to show you how I looked at the tape today during the FOMC minutes to start off, I’m just going to show you what I’m looking at right now. We have the reconstructed tape up here for the NASDAQ, NQ down here for ES in down here for RTY or the Russell also up here, I just have, um, just 1000 trade charts.
Of the e-mini S&P using hiken-ashi. I’m really never looking at this chart. I just put it up so that you could tell in context where we’re at in the day I’m Pacific time. So the market opens for me at six 30 in the morning that you can’t see. So I basically have all the charts sinked and. This is where the FOMC minutes happened.
They were pretty muted. So not a whole lot happened. Just some large orders hit the tape. And then we traded sideways for a little bit traded up. I actually almost got long here, but thought that maybe this was just exhaustion. So thankfully it traded down, traded up and then I’m not going to go over how this line is drawn, but it’s automatically drawn by the reconstructed tape.
As you can see, there were people who were defending it right here. And at this point in time, we’re now about five minutes into the FOMC minutes after they were released. And there wasn’t really any selling occurring until this period right here. There was mostly some buying and then some selling right here, potentially the same people that bought right here sold.
Okay. And at this point in time, I wasn’t really sure what to do. So I was just watching, watching, watching, and then, you know, more red had started hitting the tape, some green. Bubbles starts showing up. Then we traded down. I still haven’t done anything at this point. As you can see, we had already traded down quite a bit.
Maybe I was thinking to myself, well, I didn’t catch six points of this move, but it doesn’t matter. Then another bot or bots hit the tape, you know, or something happened, who knows it doesn’t really matter, but you know, the tape got a little bit more active. So you start paying a little bit more attention and you look at the enqueue tape, you start seeing some buys and then what happens?
We trade up slowly but surely, and you can see it over here just so you can get a little bit more context, trade up, trade up, trued up. And then there’s a big red ball that shows up in the tape 400 lots. And then that actually reverses the market bring is, brings the market down. And I believe at some point in time around here is when I started shorting because that’s what really gave me the confidence that we were going to start making lower lows.
When you’re watching the tape, do you want to start looking for things that weren’t happening before now are maybe quote on quote considered unusual? Right. So previously we saw multiple orders together, hitting the tape. We saw some buys before, after some cells, and then we saw something very unusual for that time.
Of course, every time it’s different, but we saw a big red order hit the tape, and then we started seeing. These consistent red orders, the sell orders hitting the tape around the same size. Right. So if you’re looking at the size right here, 200, 250, 250, there’s another 200 right here. There’s another 250 right here.
And you have to Swift through the noise and really find the things that are outliers. The things that stick out. And this is somebody just hitting the tape consistently. Right? They’re trying to bring the market down, going, keep going, keep going. And again, you’re just observing, making sure that they’re still people selling the market so that you can stay in your trade and then eventually things change.
And that’s what you’re really looking for. You don’t really know what it’s going to look like. It always looks a little bit different. Different market participants and whatnot. So we’re still seeing this consistent sells around the same size you, so you can assume that it’s the same player forcing the market down.
And then this is unusual now, right? Things have changed. You start seeing also the big sells in NQ and in the Russell, something is different now. And either we’re going to. Really drop or maybe there’s another trader on the other side, absorbing these large orders, potentially. There’s also traders who are essentially selling so that they can buy the market up again.
And you also start seeing some larger buys. So saw one back here. So you have to be vigilant for these things. And now you’re on your toes seeing potential for the market to reverse. And then again, you start seeing like these consecutive buy orders. This is actually pretty typical where you see multiple buys around the same size, just popping there, like pop up and then the market goes up and sure enough, that’s what happens.
And you can see it happening right here. So, you know, after you look at the tape for long enough, you start seeing these patterns and it never really looks the same, but then we started trading up and then we really just ranged for the rest of the day. You can see it through here. Um, and now we’re just back in the same balance area that we were personally before.
So I’ll just leave it at that. I hope that this was helpful and until next time everyone, happy trading!